Map & Data
ground-truth-visualization.onrender.com.
Datasets
Ground Truth uses American Community Survey (ACS) data at the block-group level, constructing a relatively detailed picture of housing affordability across New York City.
The main measure is rent burden: the percentage of a household’s income spent on rent and utilities. This follows HUD’s longstanding 30 percent standard, which considers households cost-burdened when their housing expenses exceed 30 percent of their income. Rent or income alone do not tell us whether housing is actually affordable. The same monthly rent can be manageable for one household and overwhelming for another.
The dataset combined two specific indicators: the median share of income spent on rent, and the percentage of renter households spending at least half of their income on housing, which is considered severely rent-burdened. These were normalized and blended into a single affordability score so that the data could reflect both the typical pressure in an area and the number of households facing especially extreme costs.
Since some wealthier households may choose to spend a large share of their income on housing without experiencing the same level of financial strain, the top quantile was removed from the final dataset.
The final score was then connected to the coordinates of each block group. The device stores a simplified version of that data locally, and as the bike’s GPS position changes, the microcontroller finds the corresponding value and translates it into a level of physical resistance.
The interactive map uses the same underlying data, so that the visual map and the physical ride become two different ways of reading the same affordability landscape.
Interactive Map
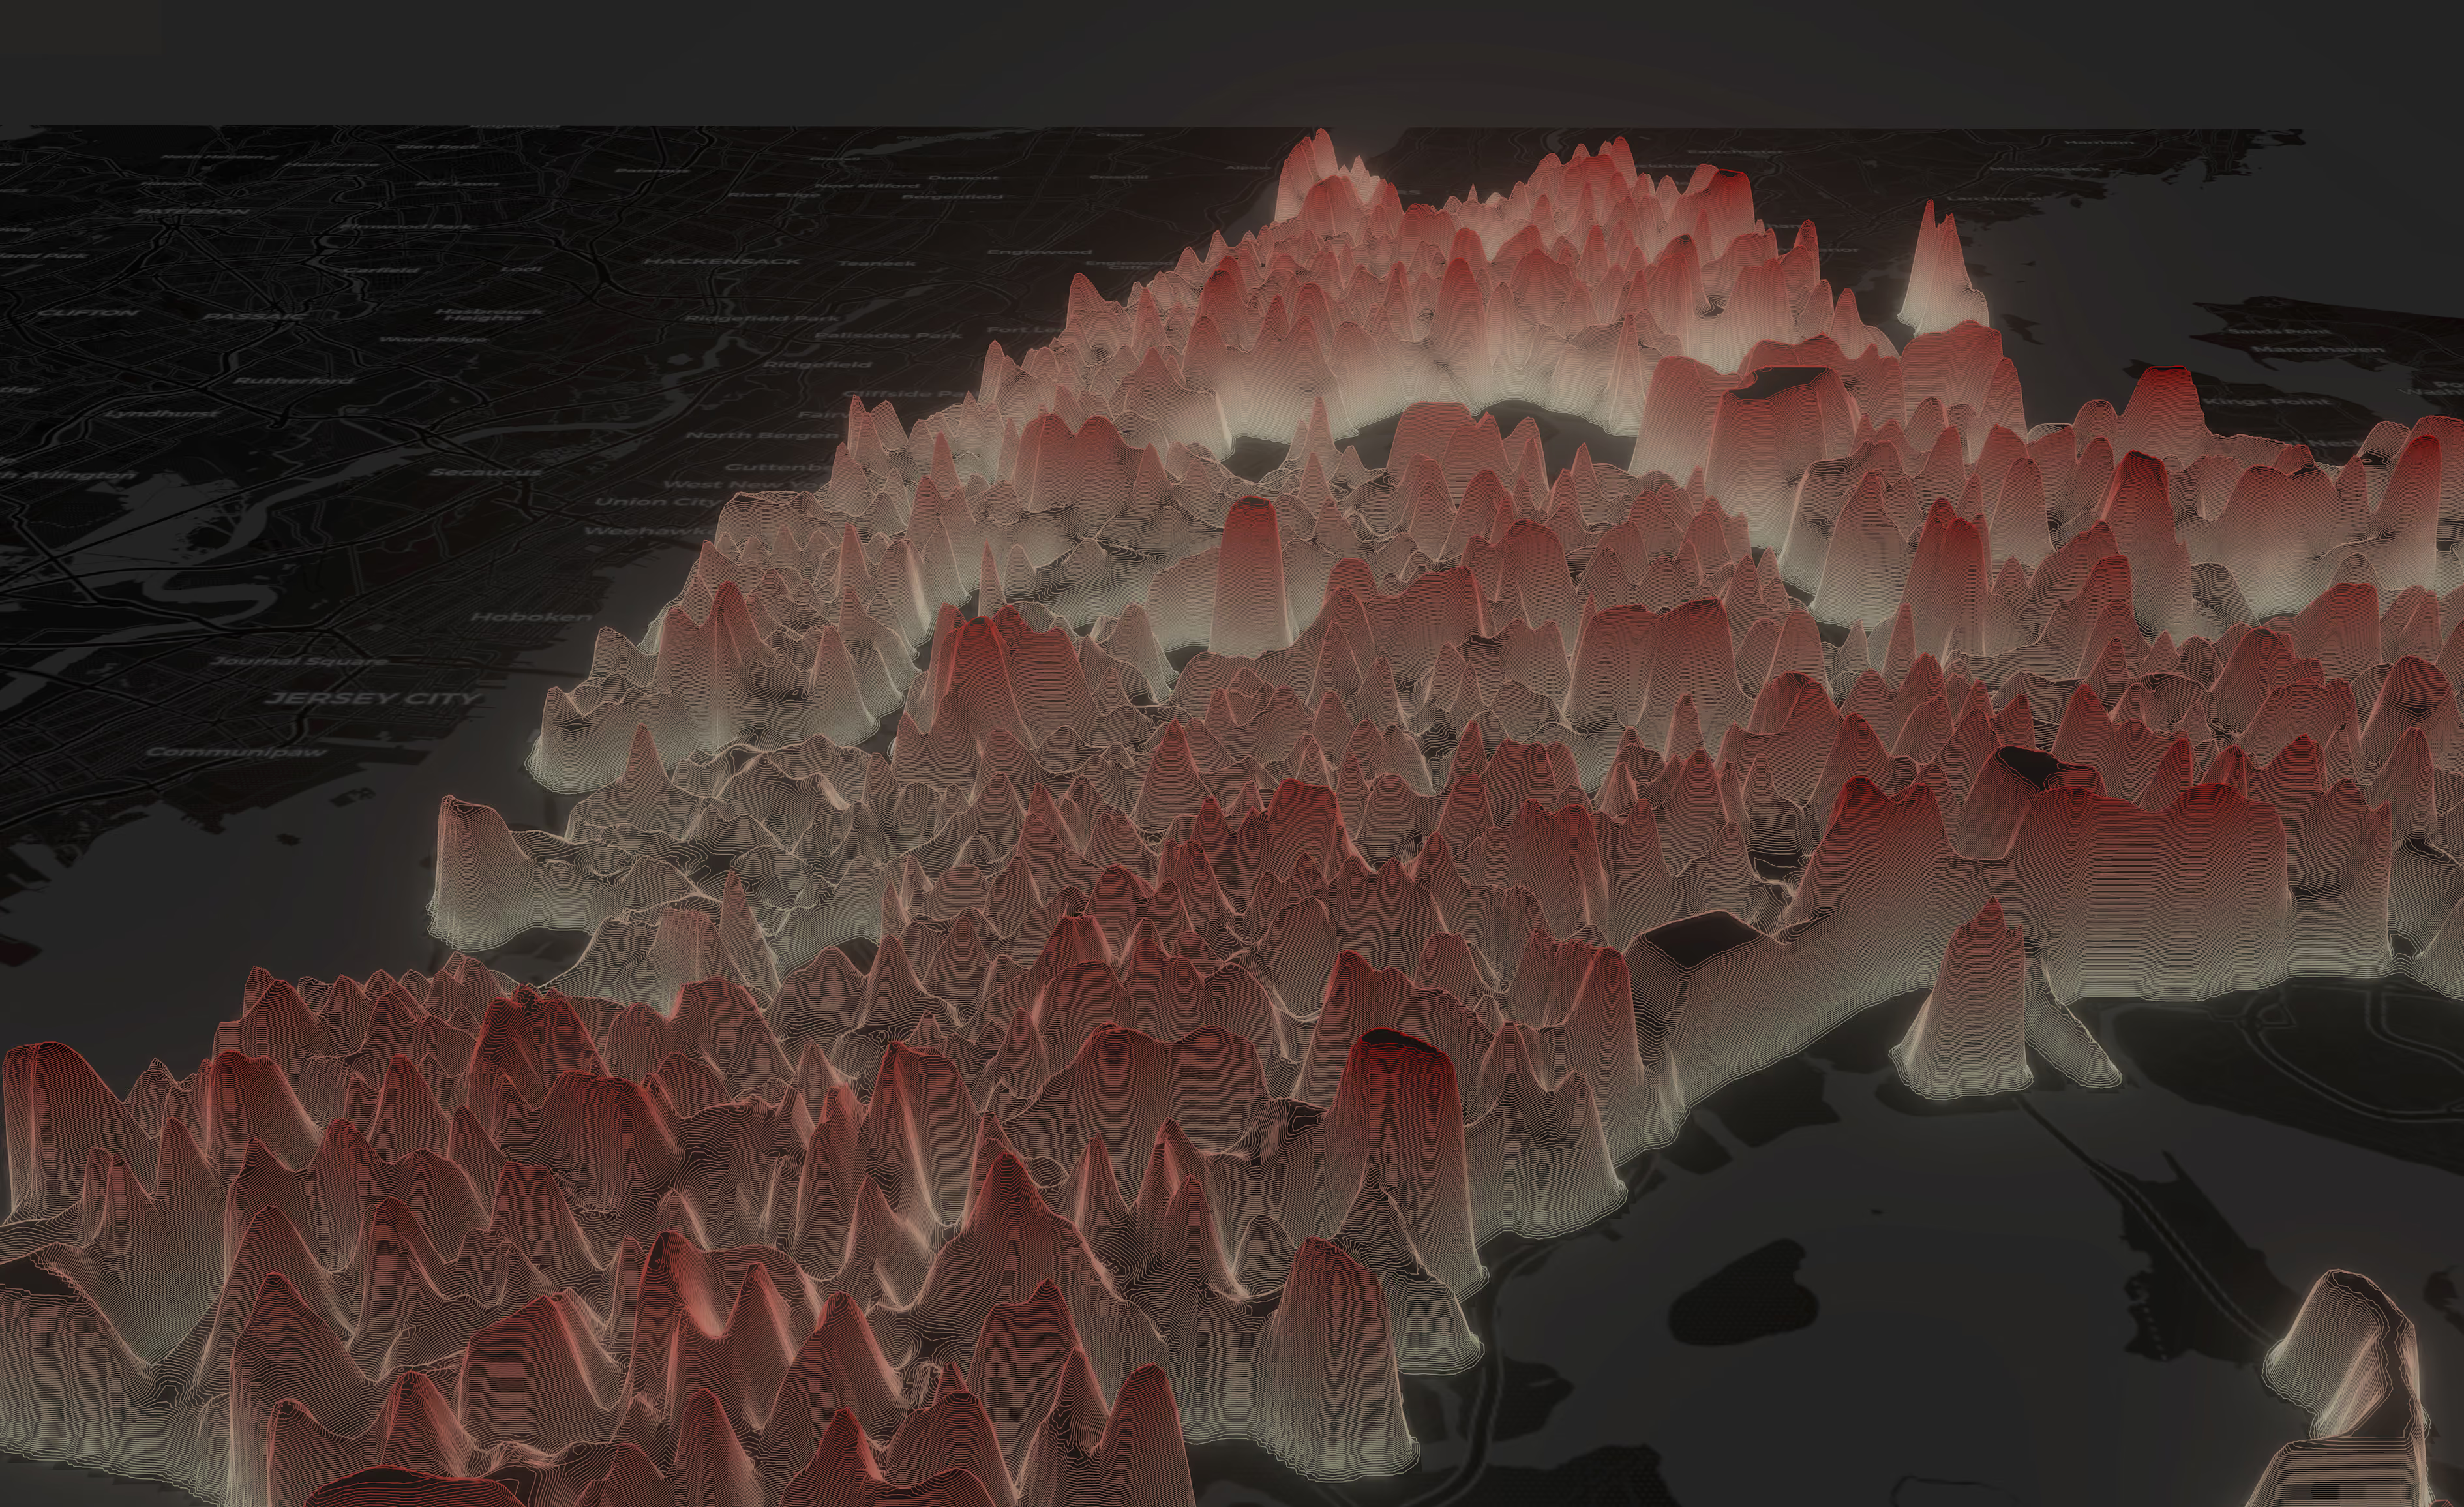
The interactive map visualizes the blended median and severe rent burden census datasets across New York City.
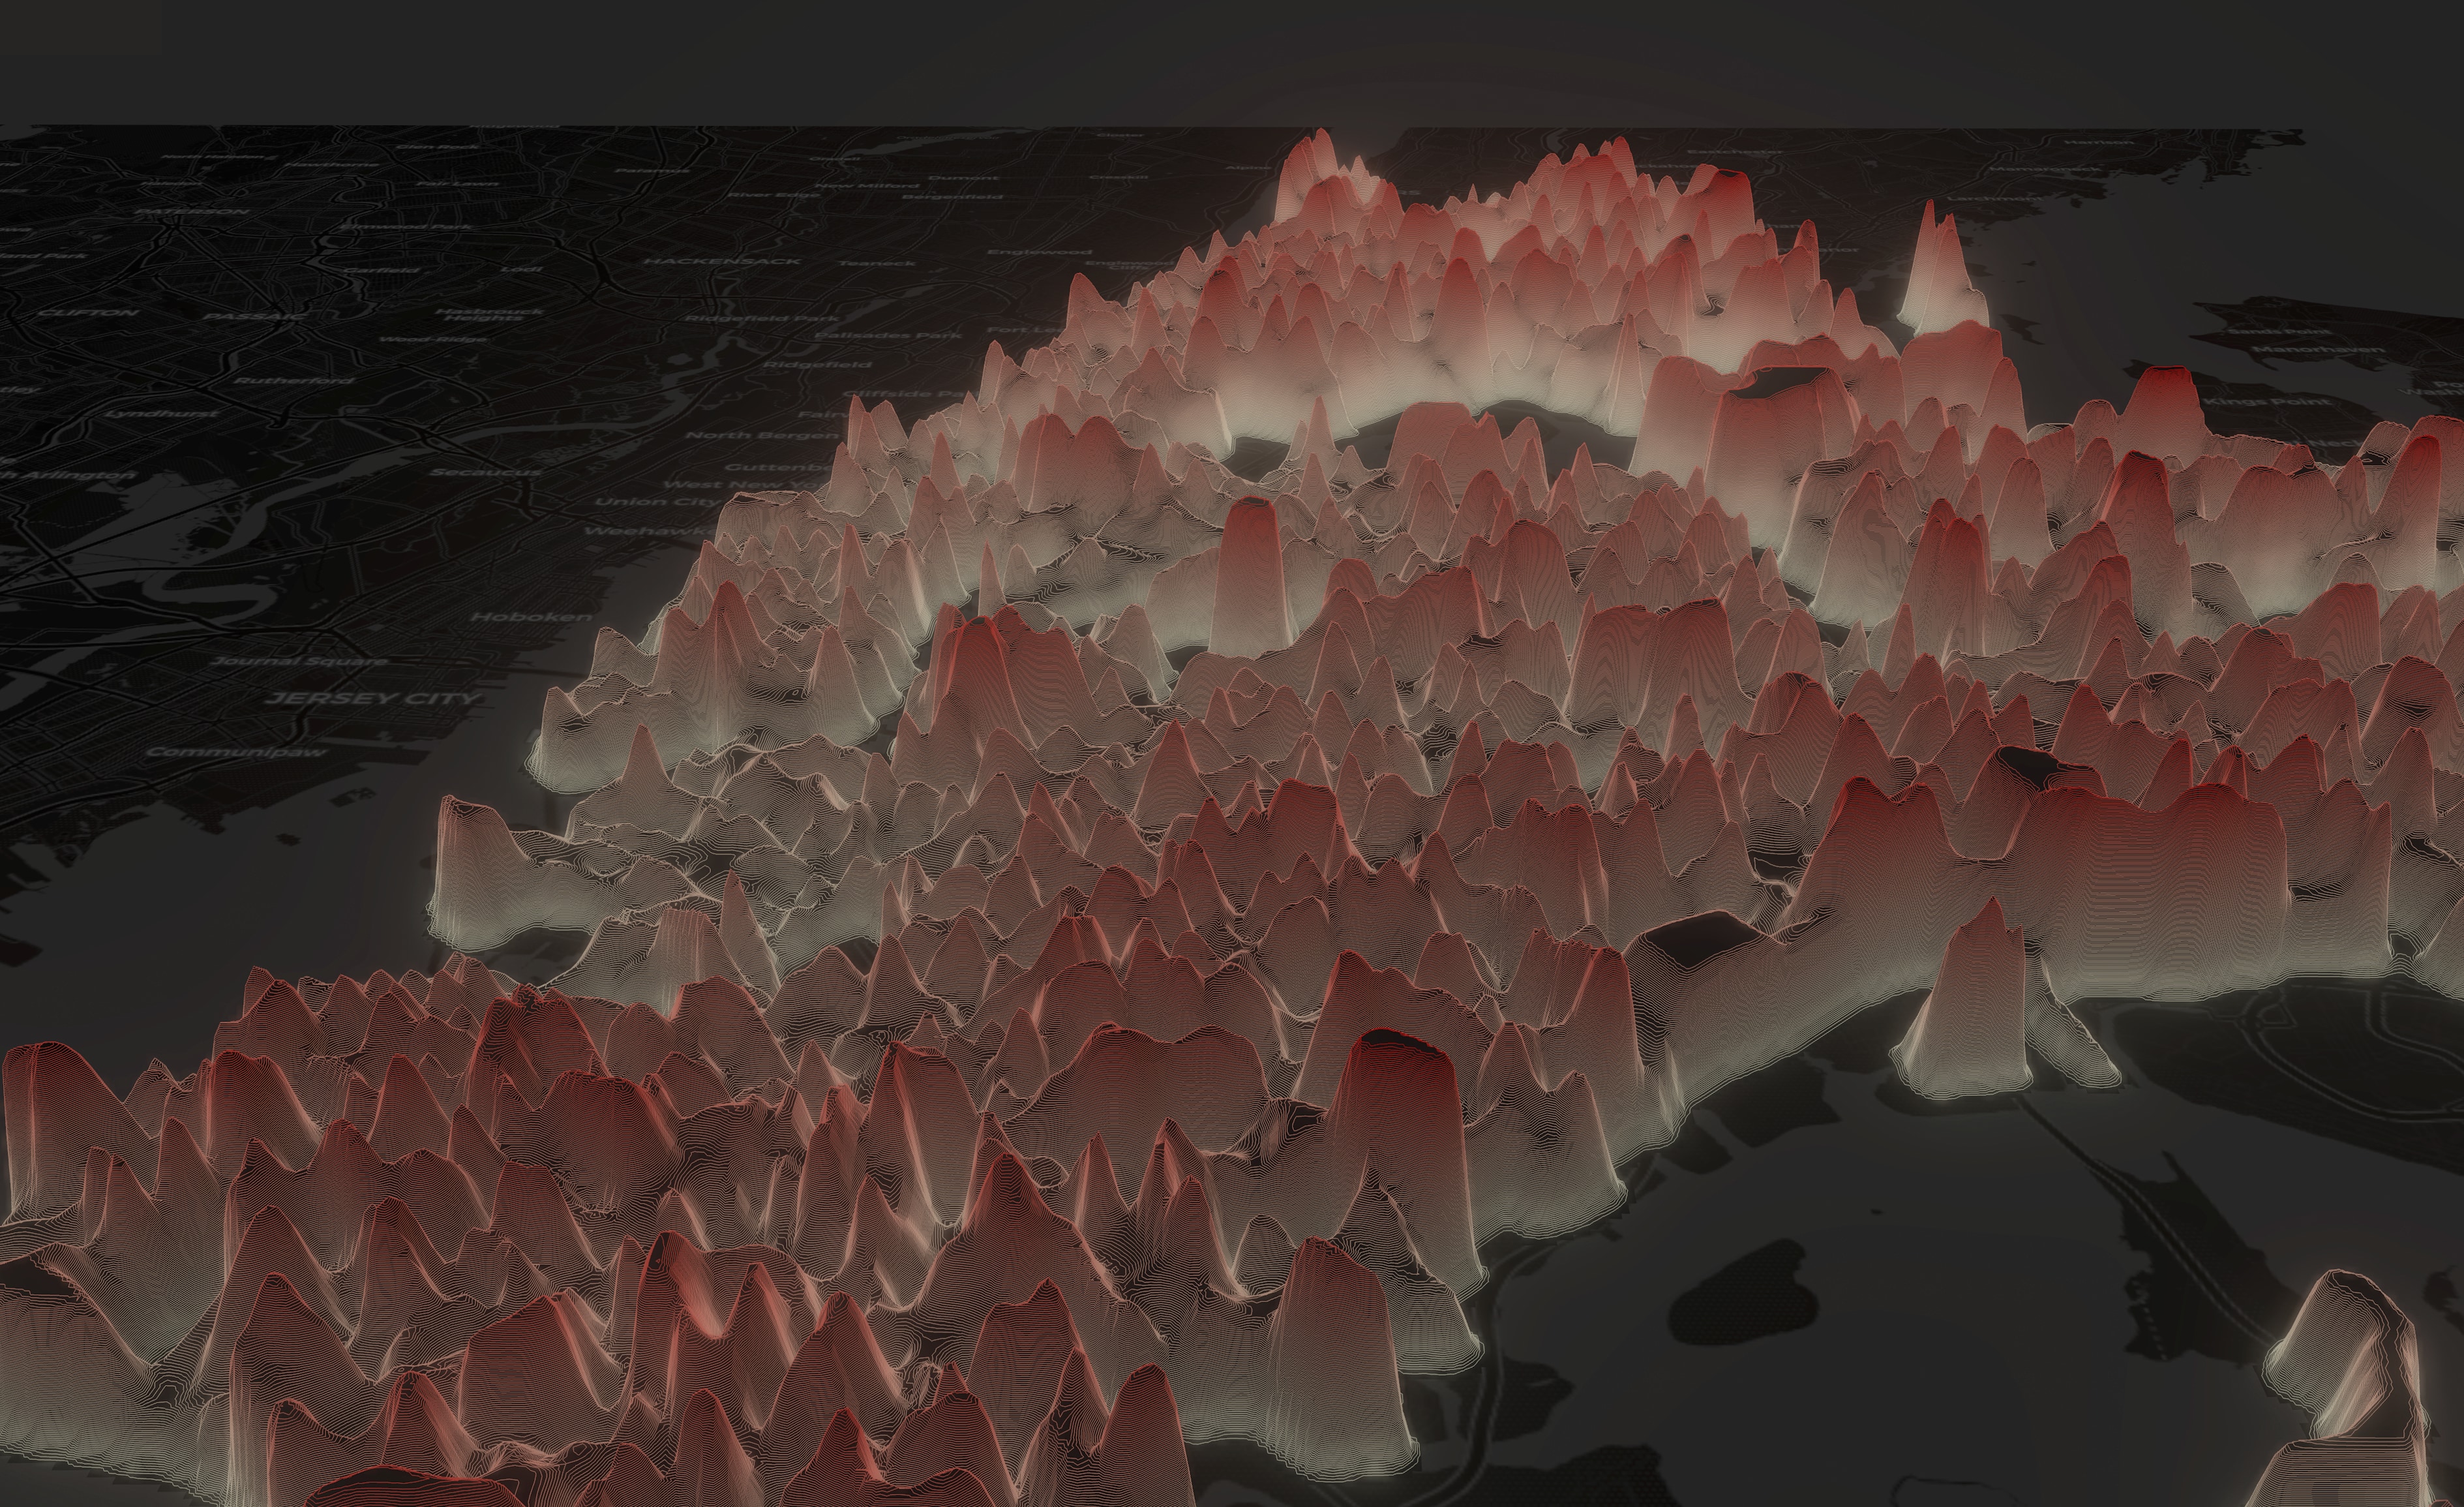
It has two different visual representations of rent pressure: per-block and contiguous. The per-block perspective shows the rent-burden percentile of a specific block group as an elevated mound. The contiguous perspective borrows the visual language of topographic survey maps. Neighboring block groups are smoothed into a continuous surface.
Device
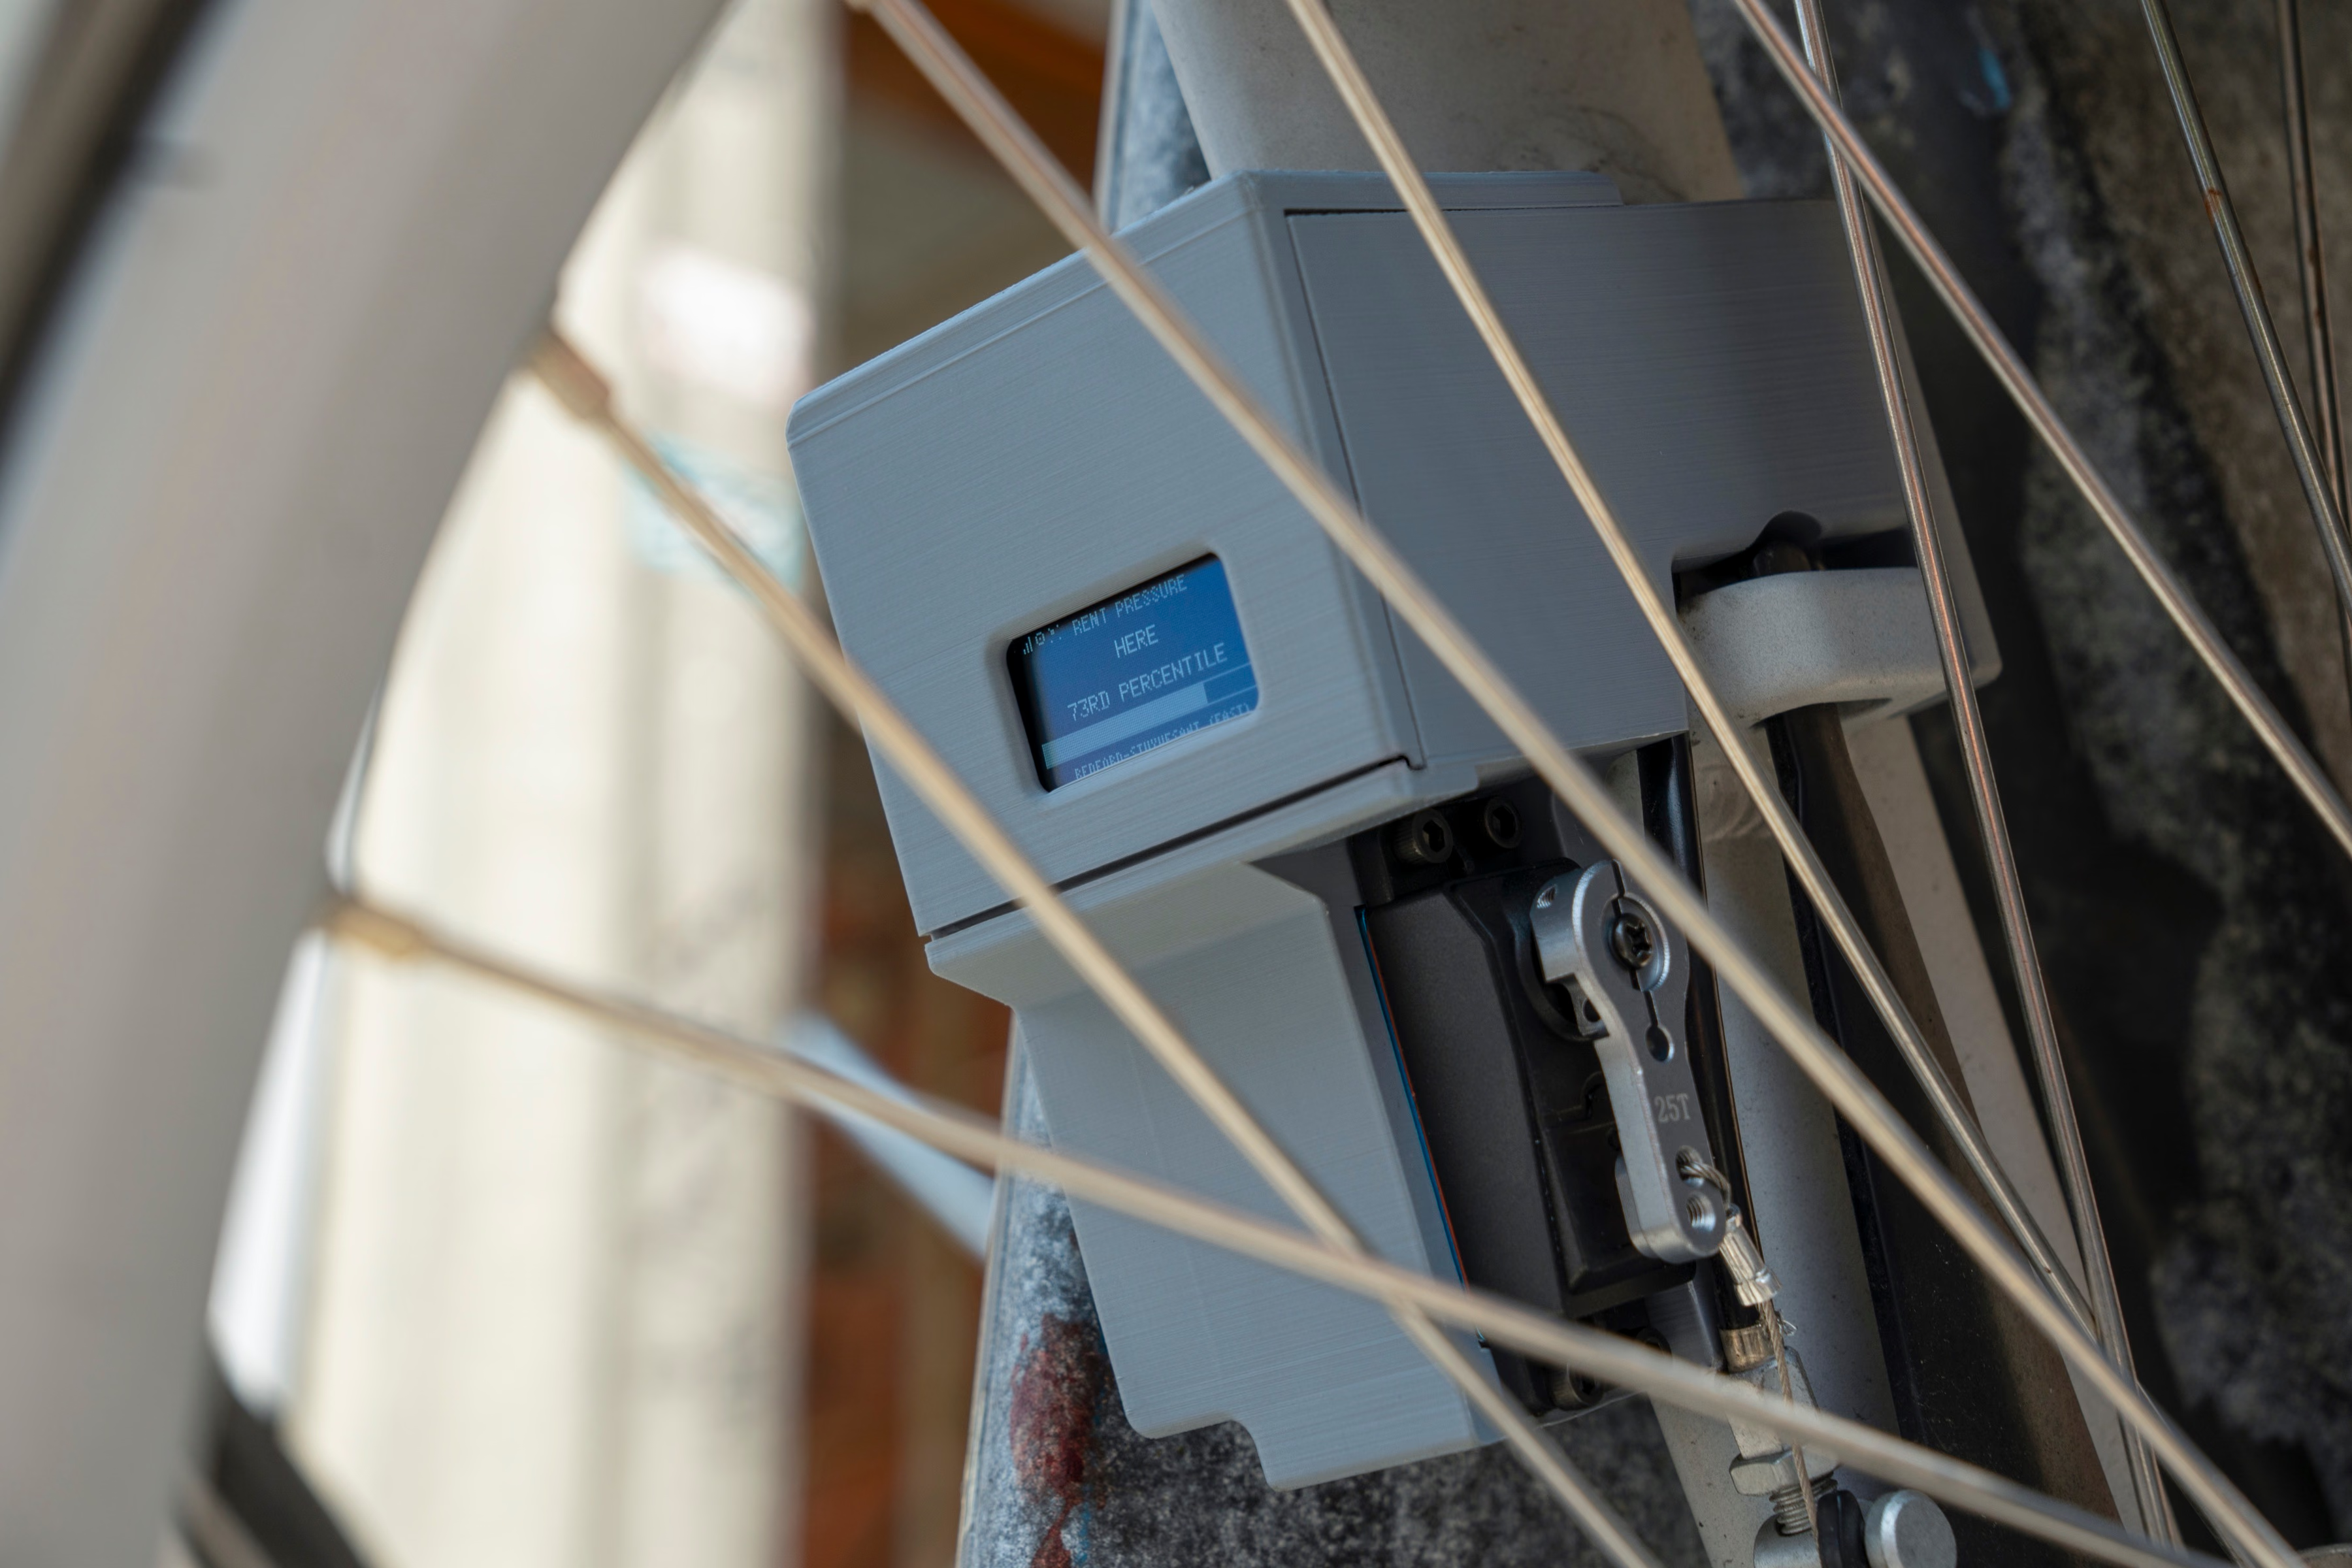
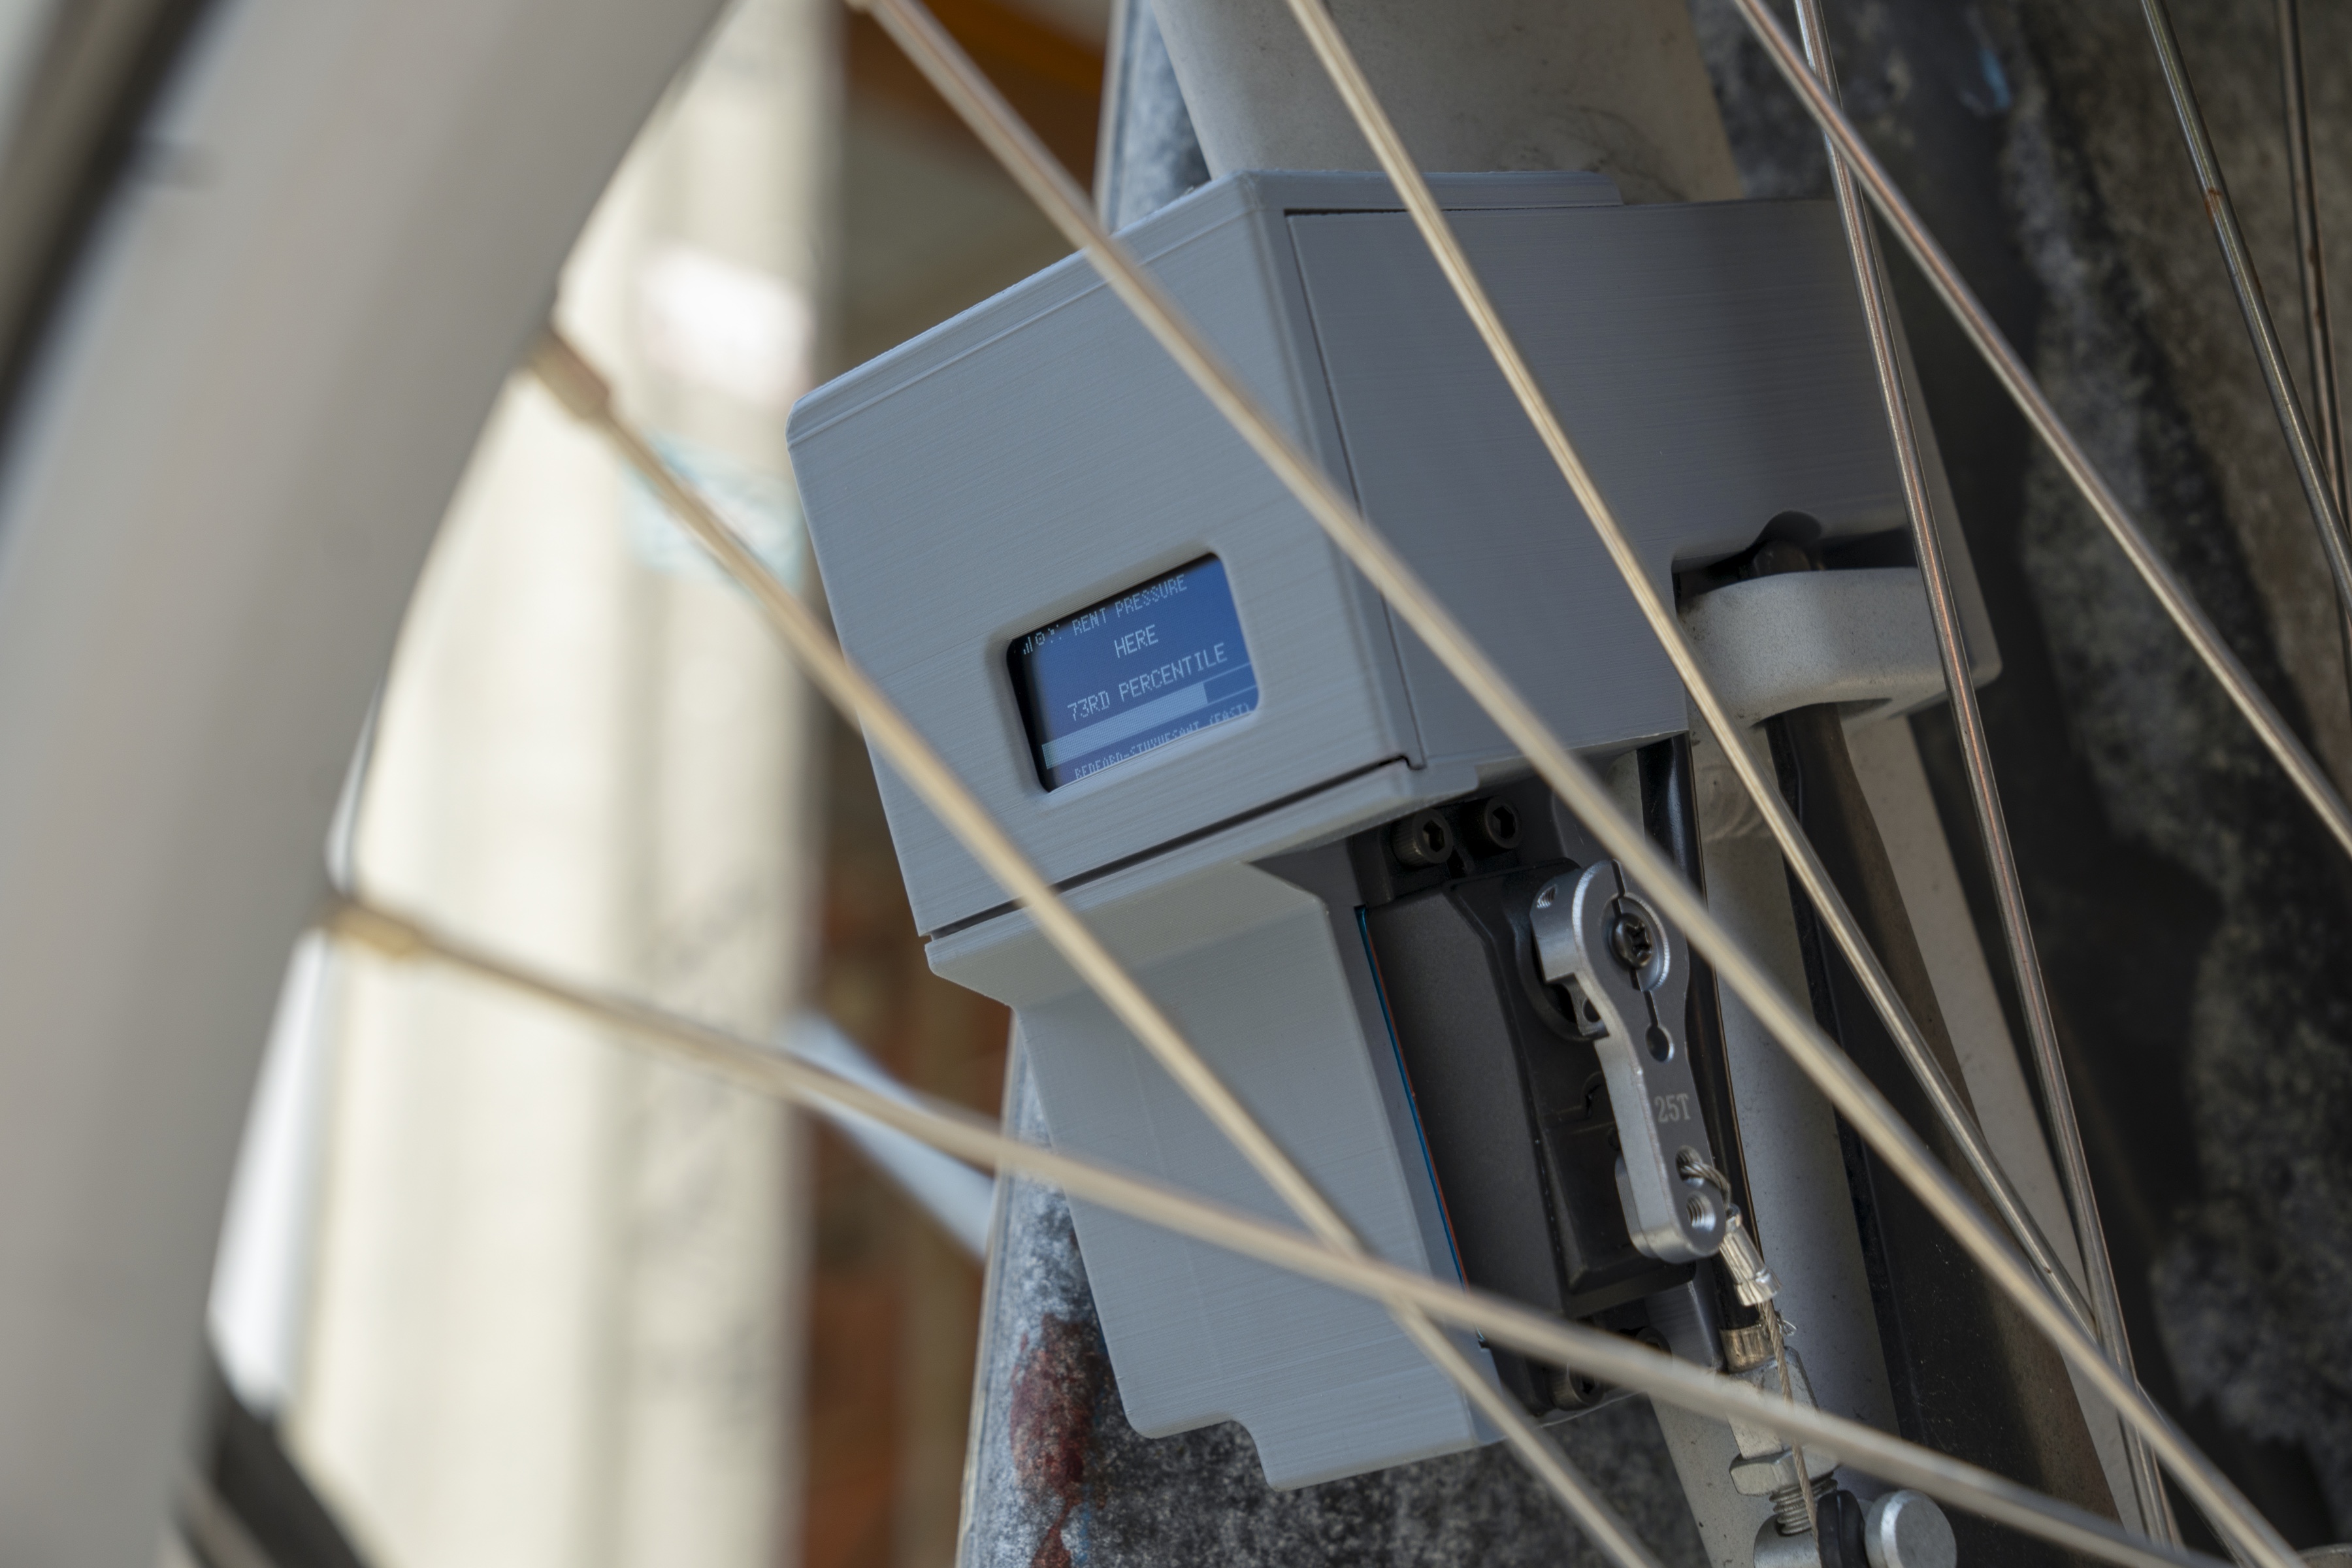
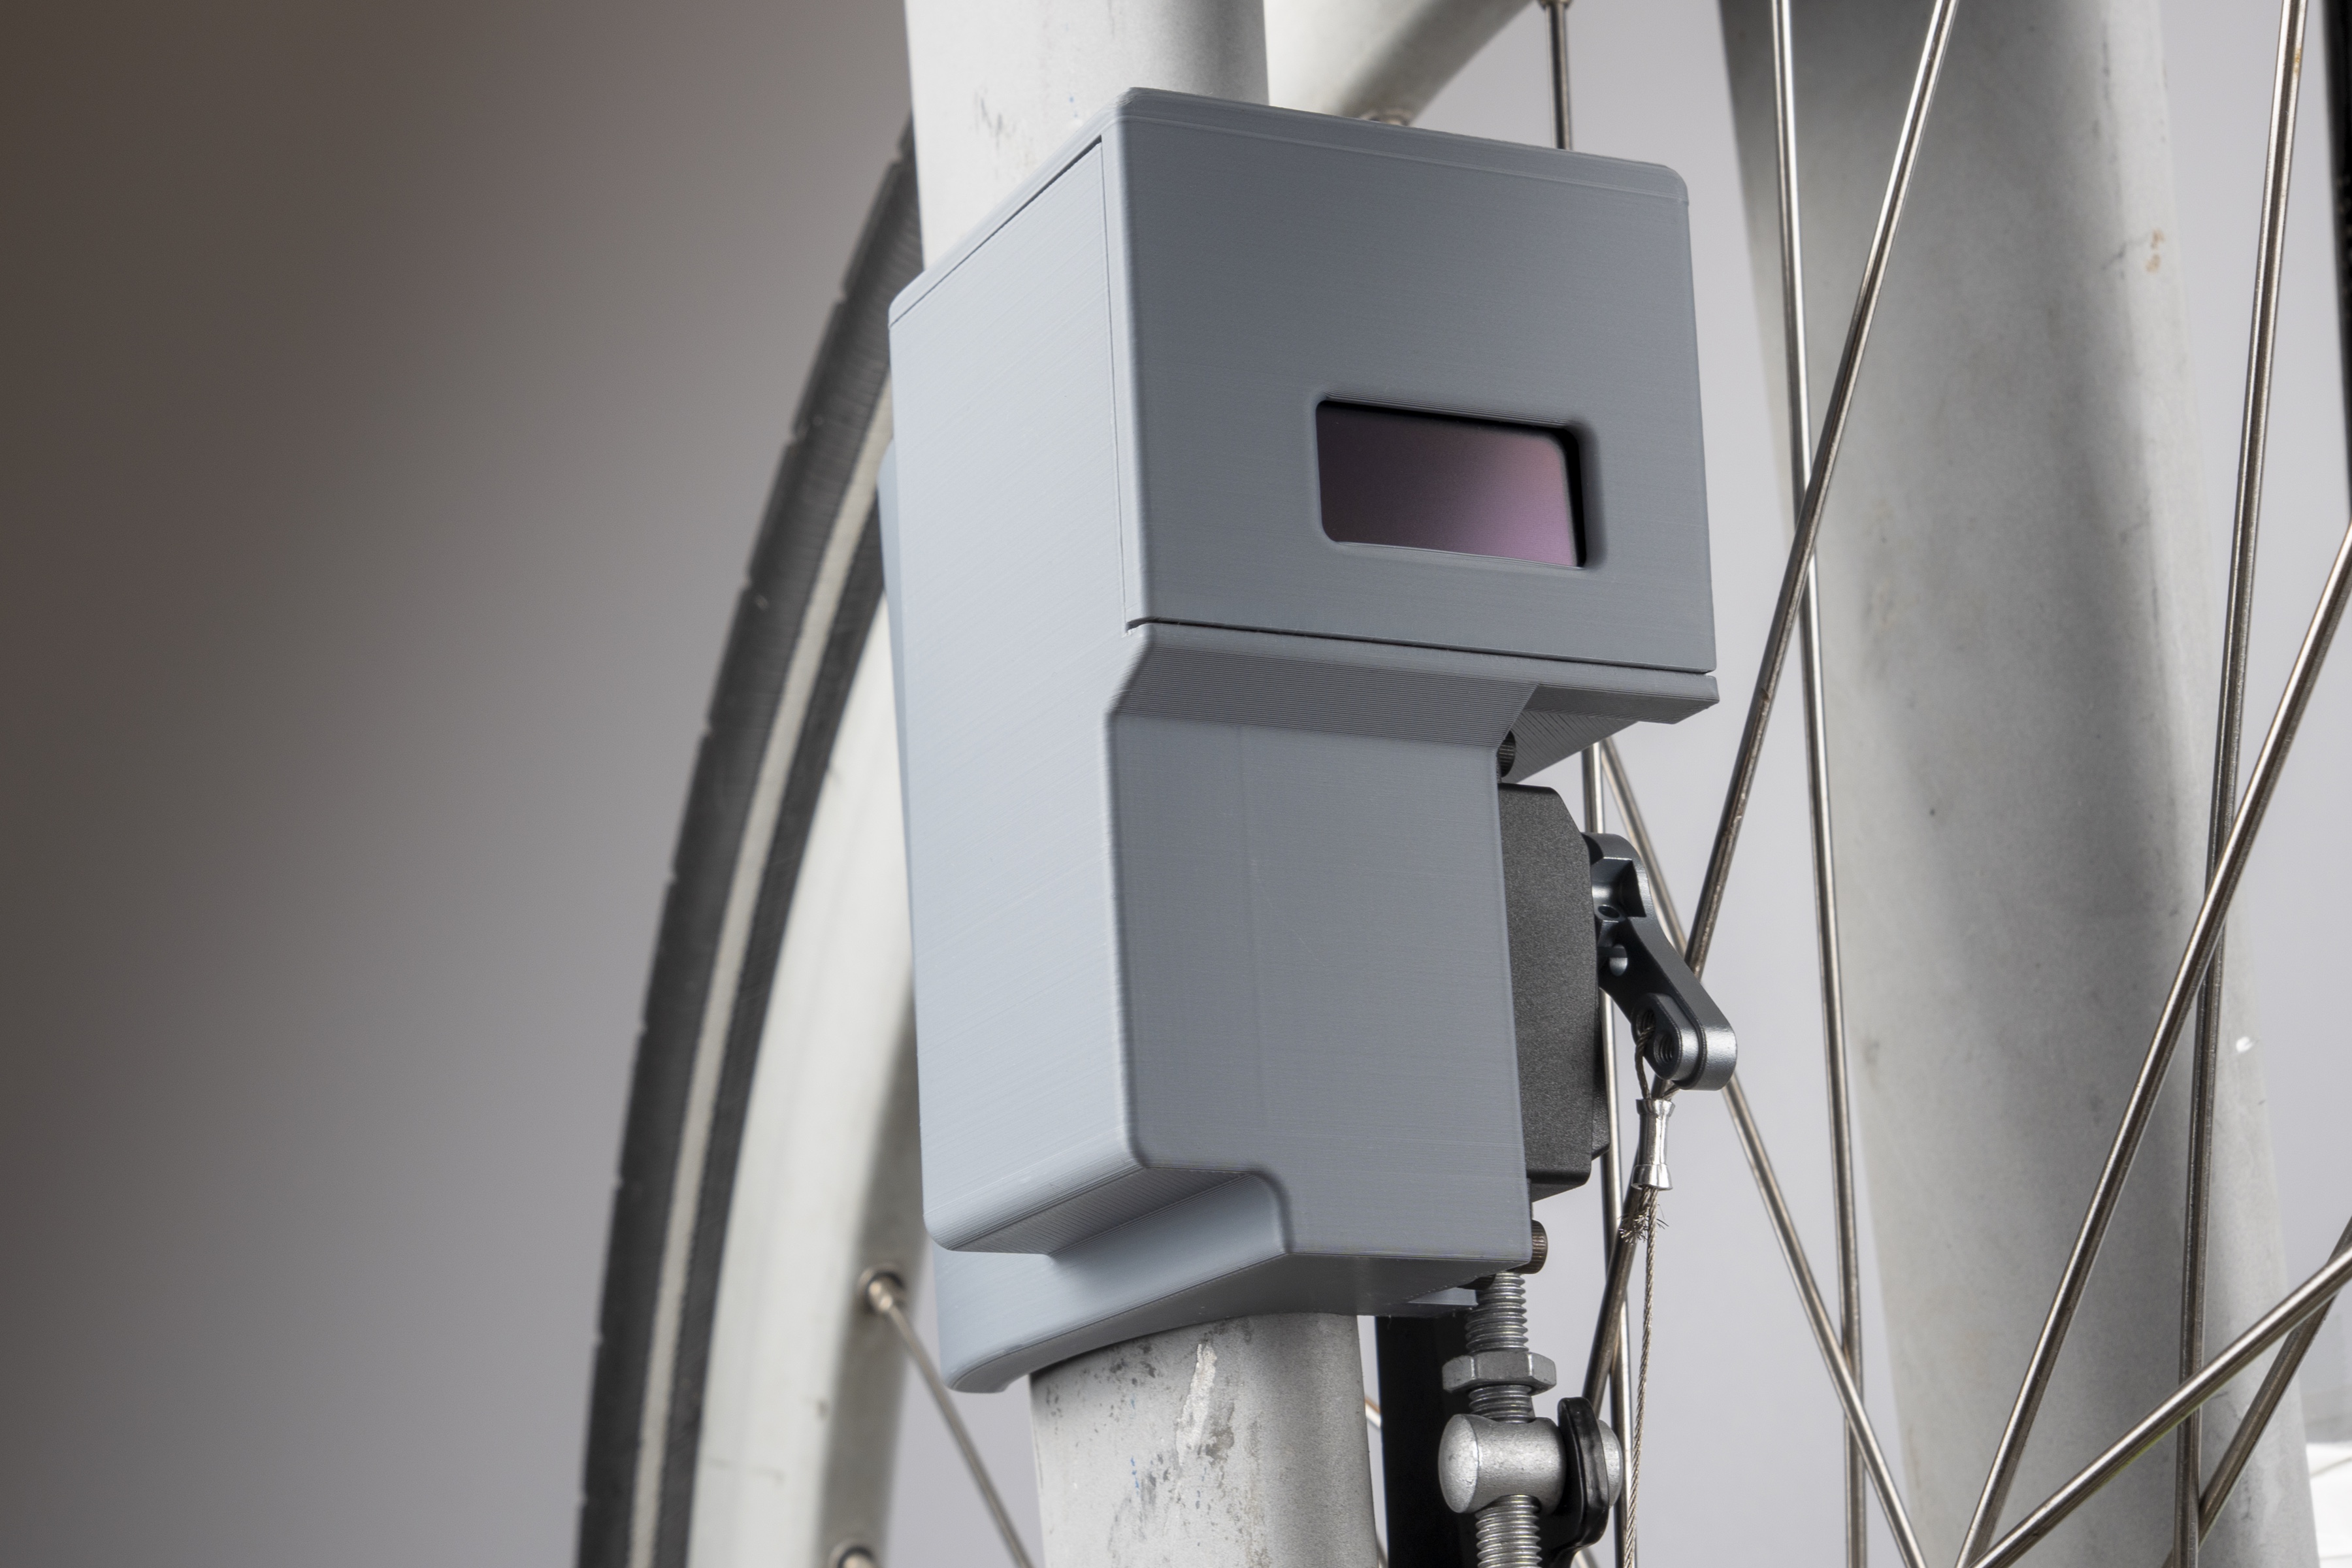
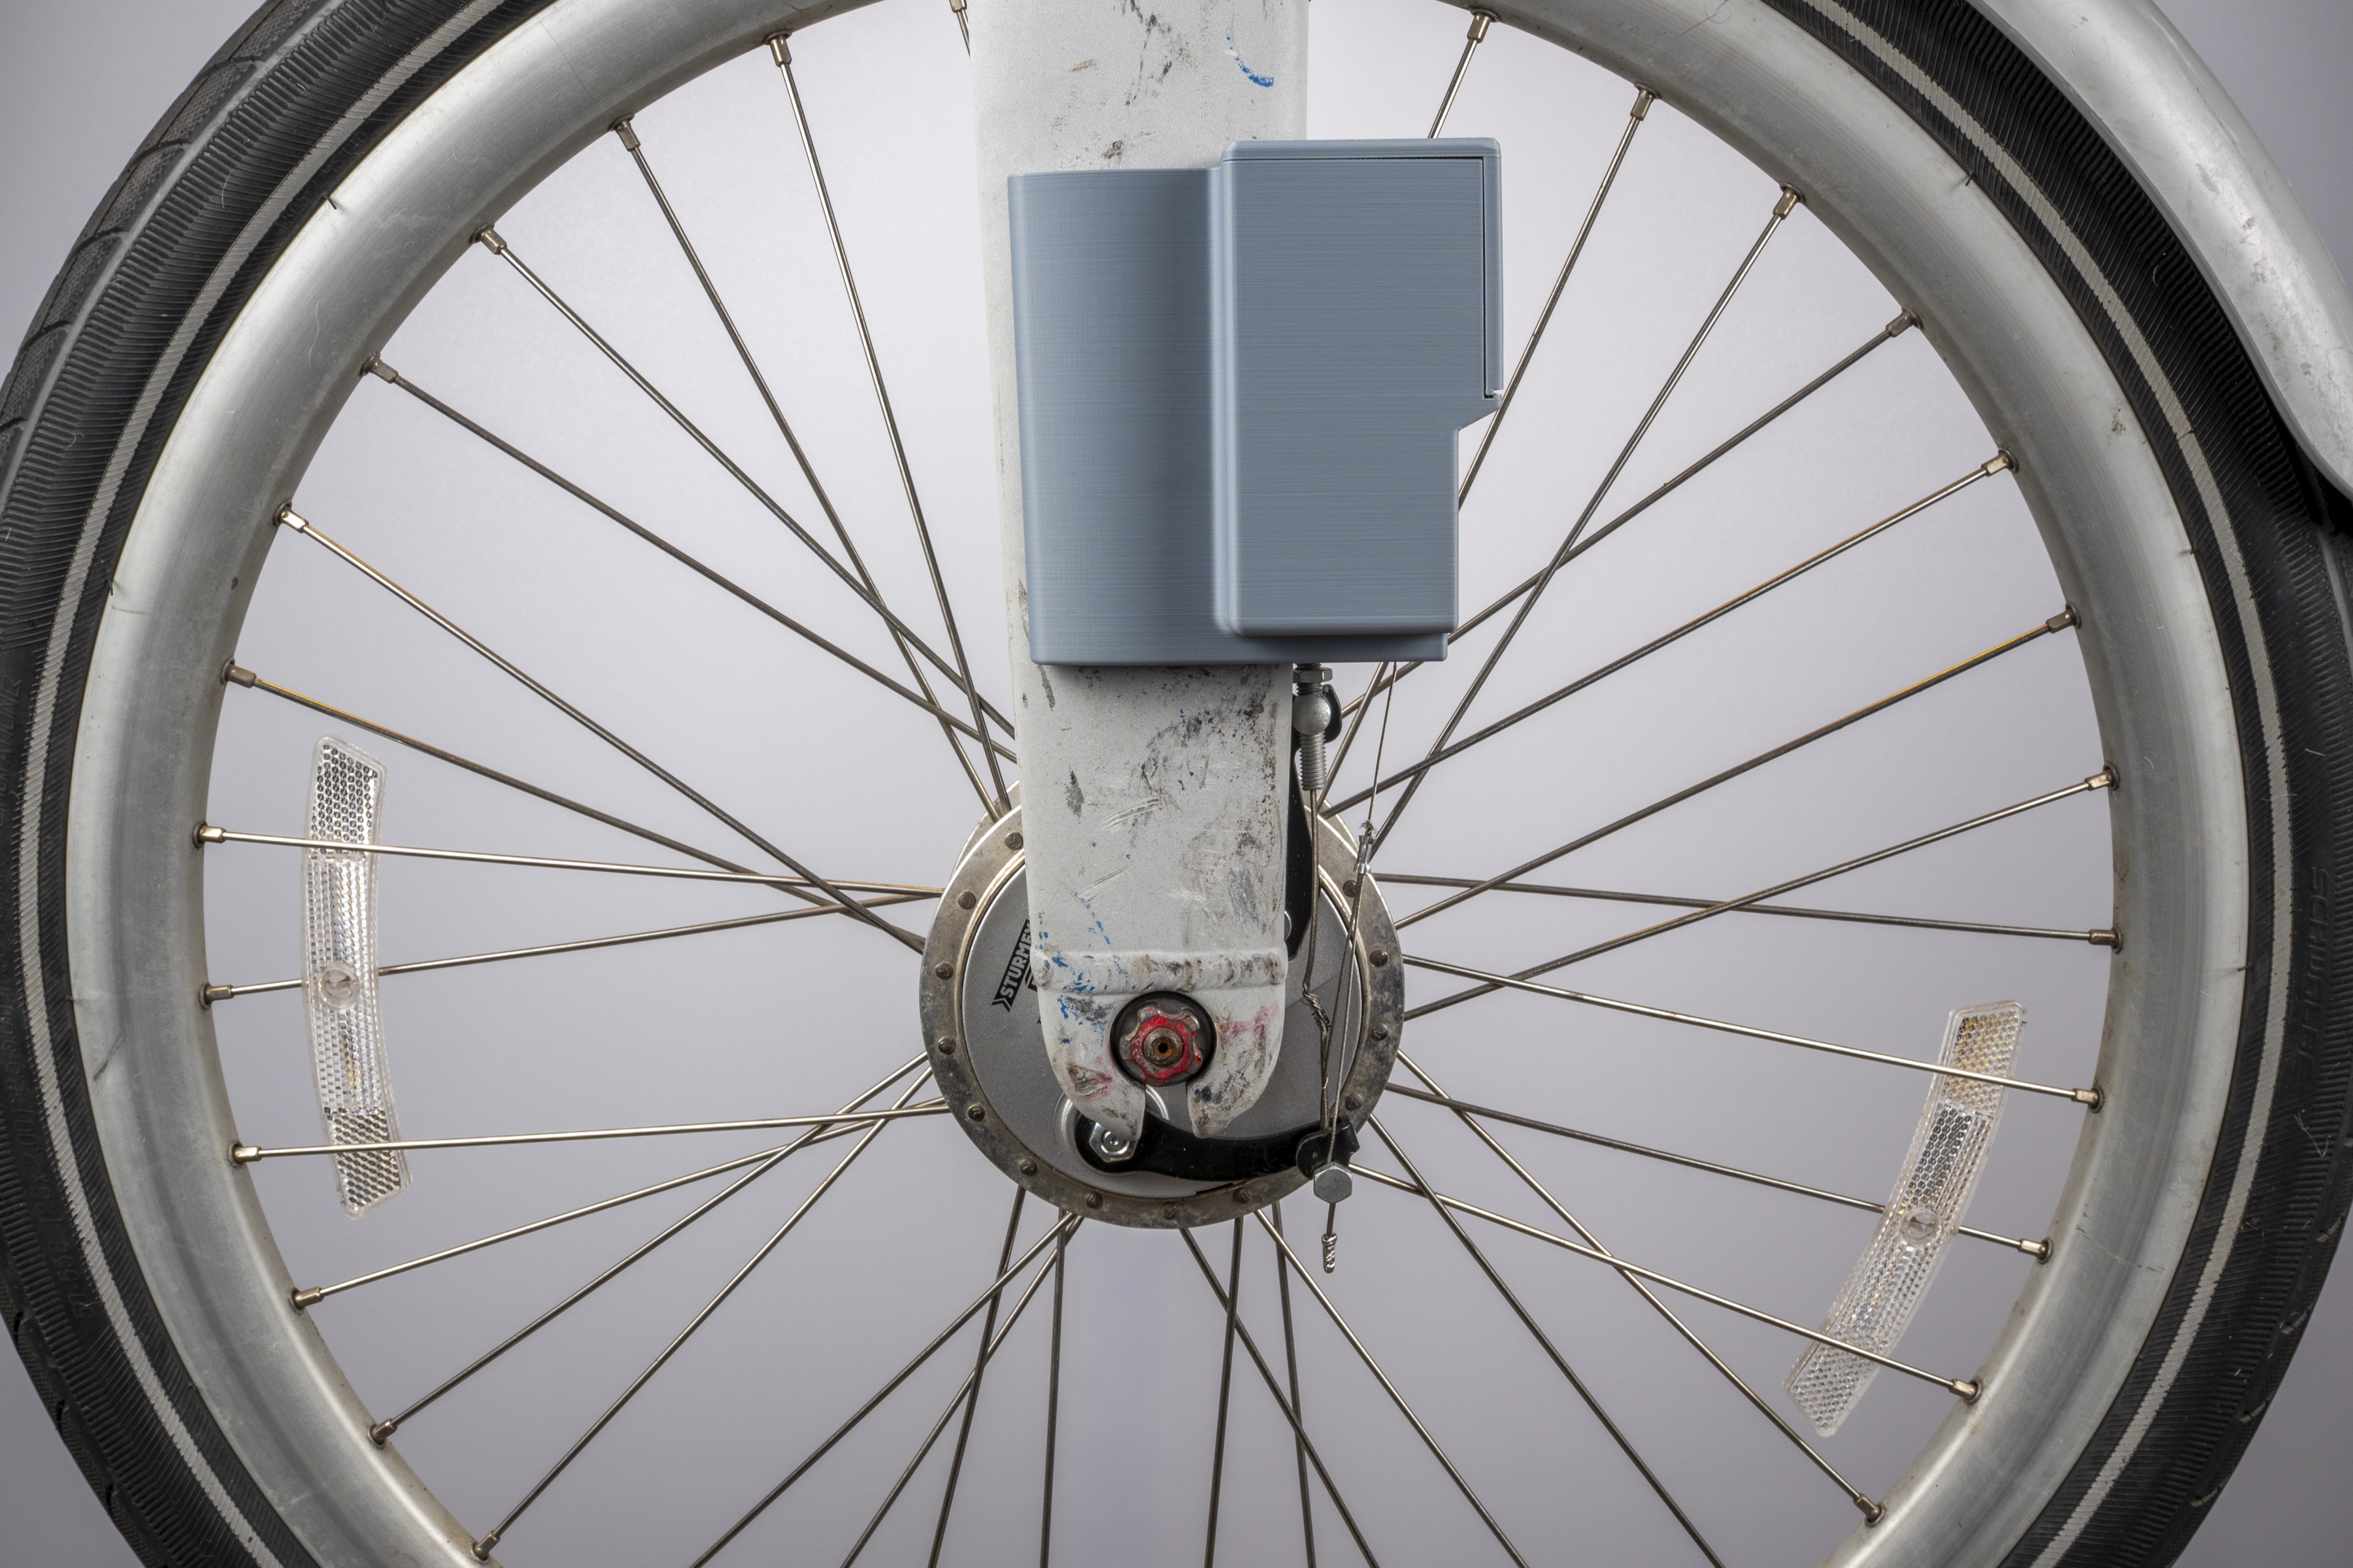
The device attaches to the front fork of a docked Citi Bike and overrides the front-brake, to adjust pedal resistance according to hyper-local rent burden data.
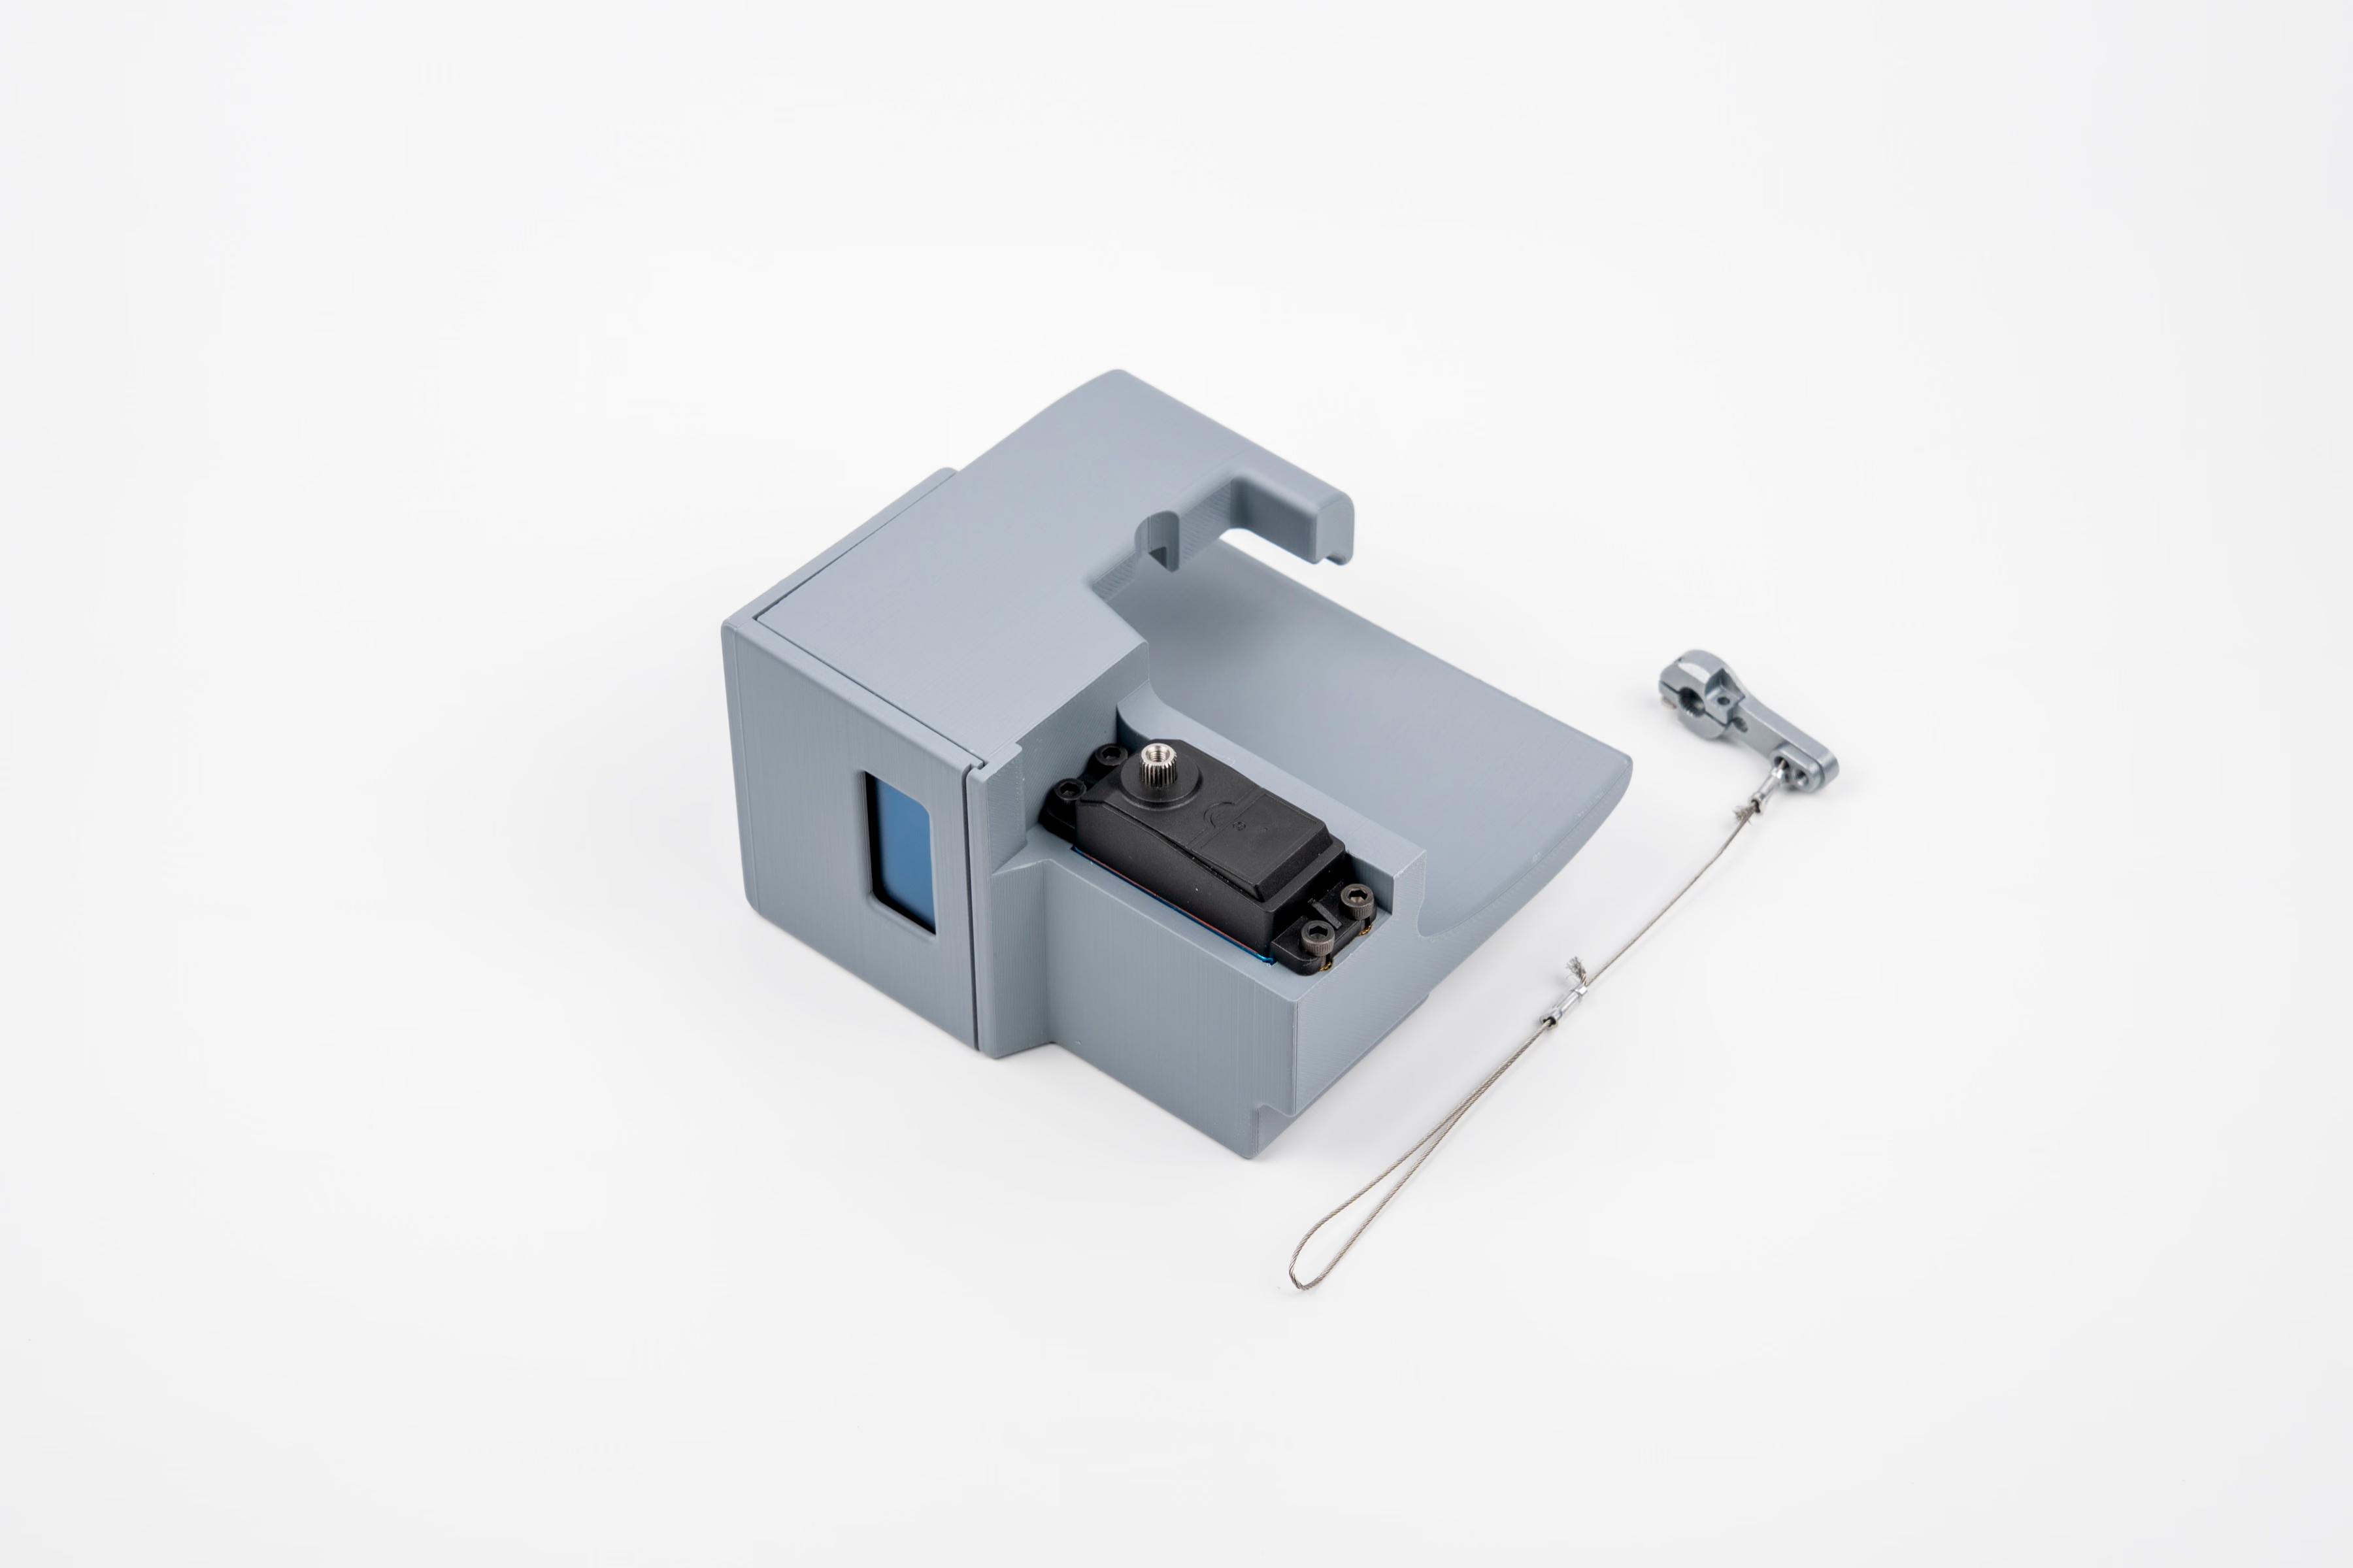
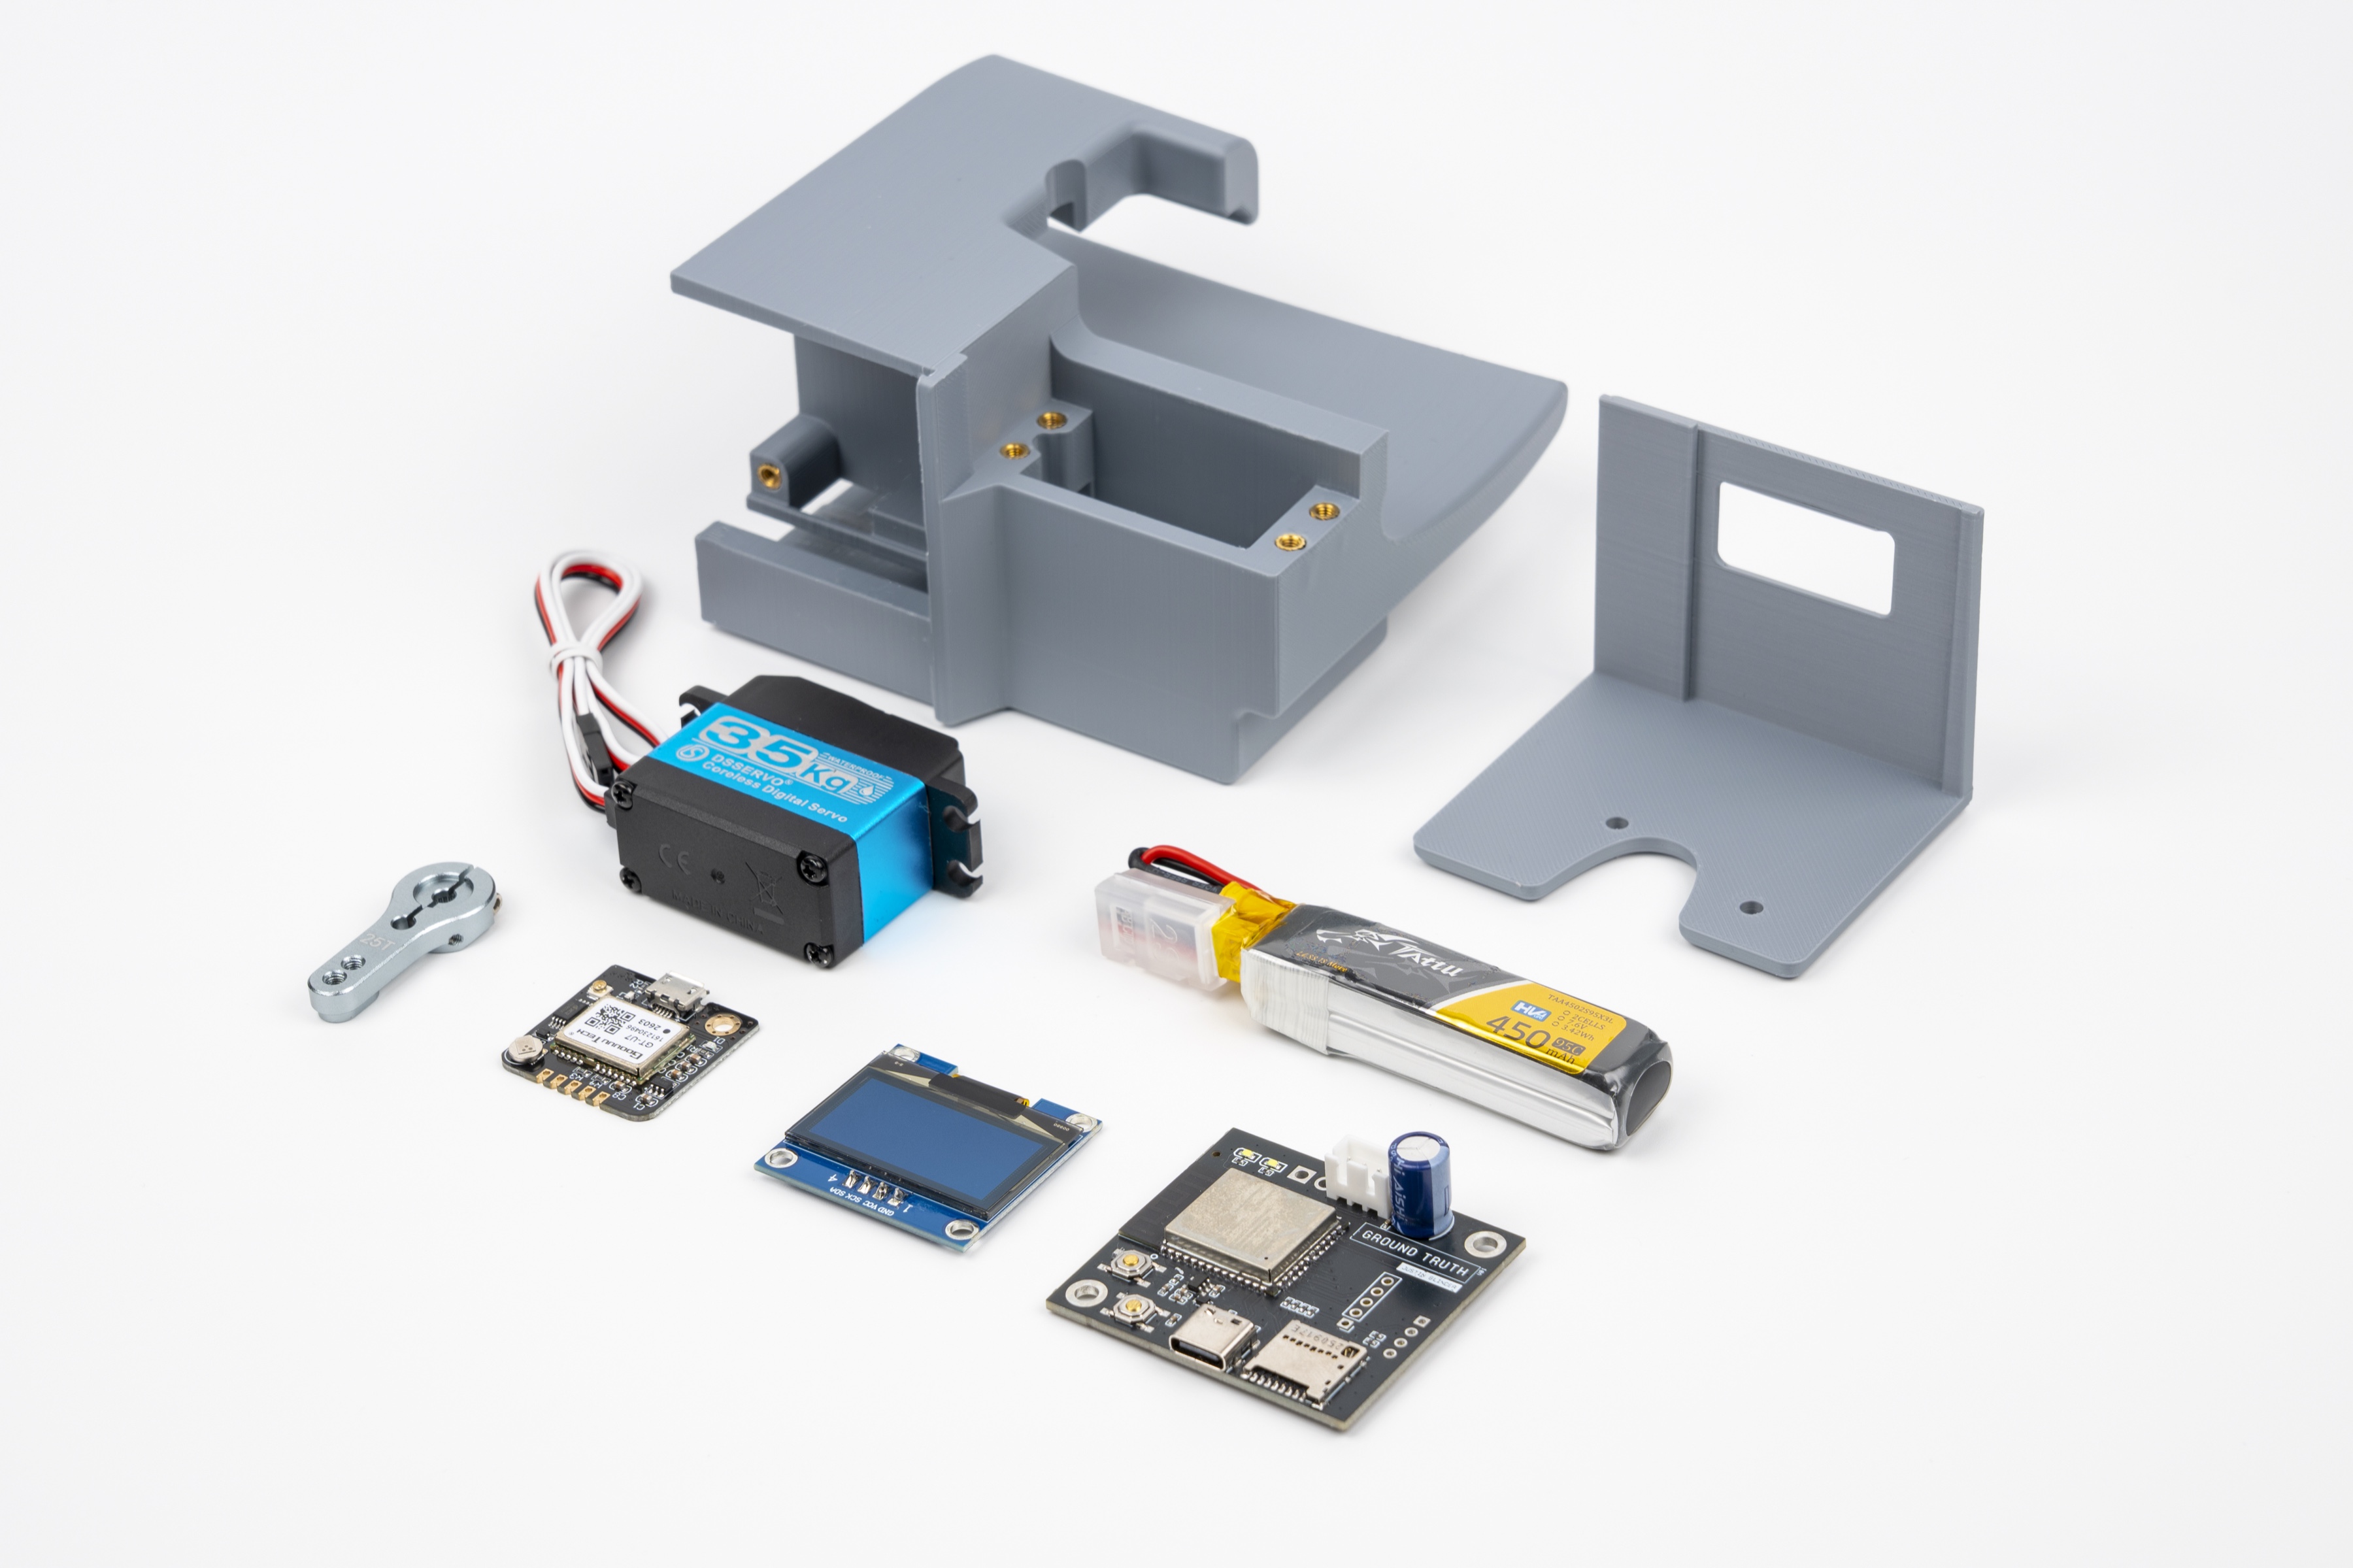
The core device was built using a GPS module, ESP32S3 microcontroller, high-torque servo motor, and an SD card reader containing a custom housing affordability dataset. As a rider moves through the city, the GPS continually polls the bike’s location. At regular intervals, the microcontroller compares those coordinates with the geographic data stored on the SD card, identifies the local rent burden, and maps that value to a specific servo angle.
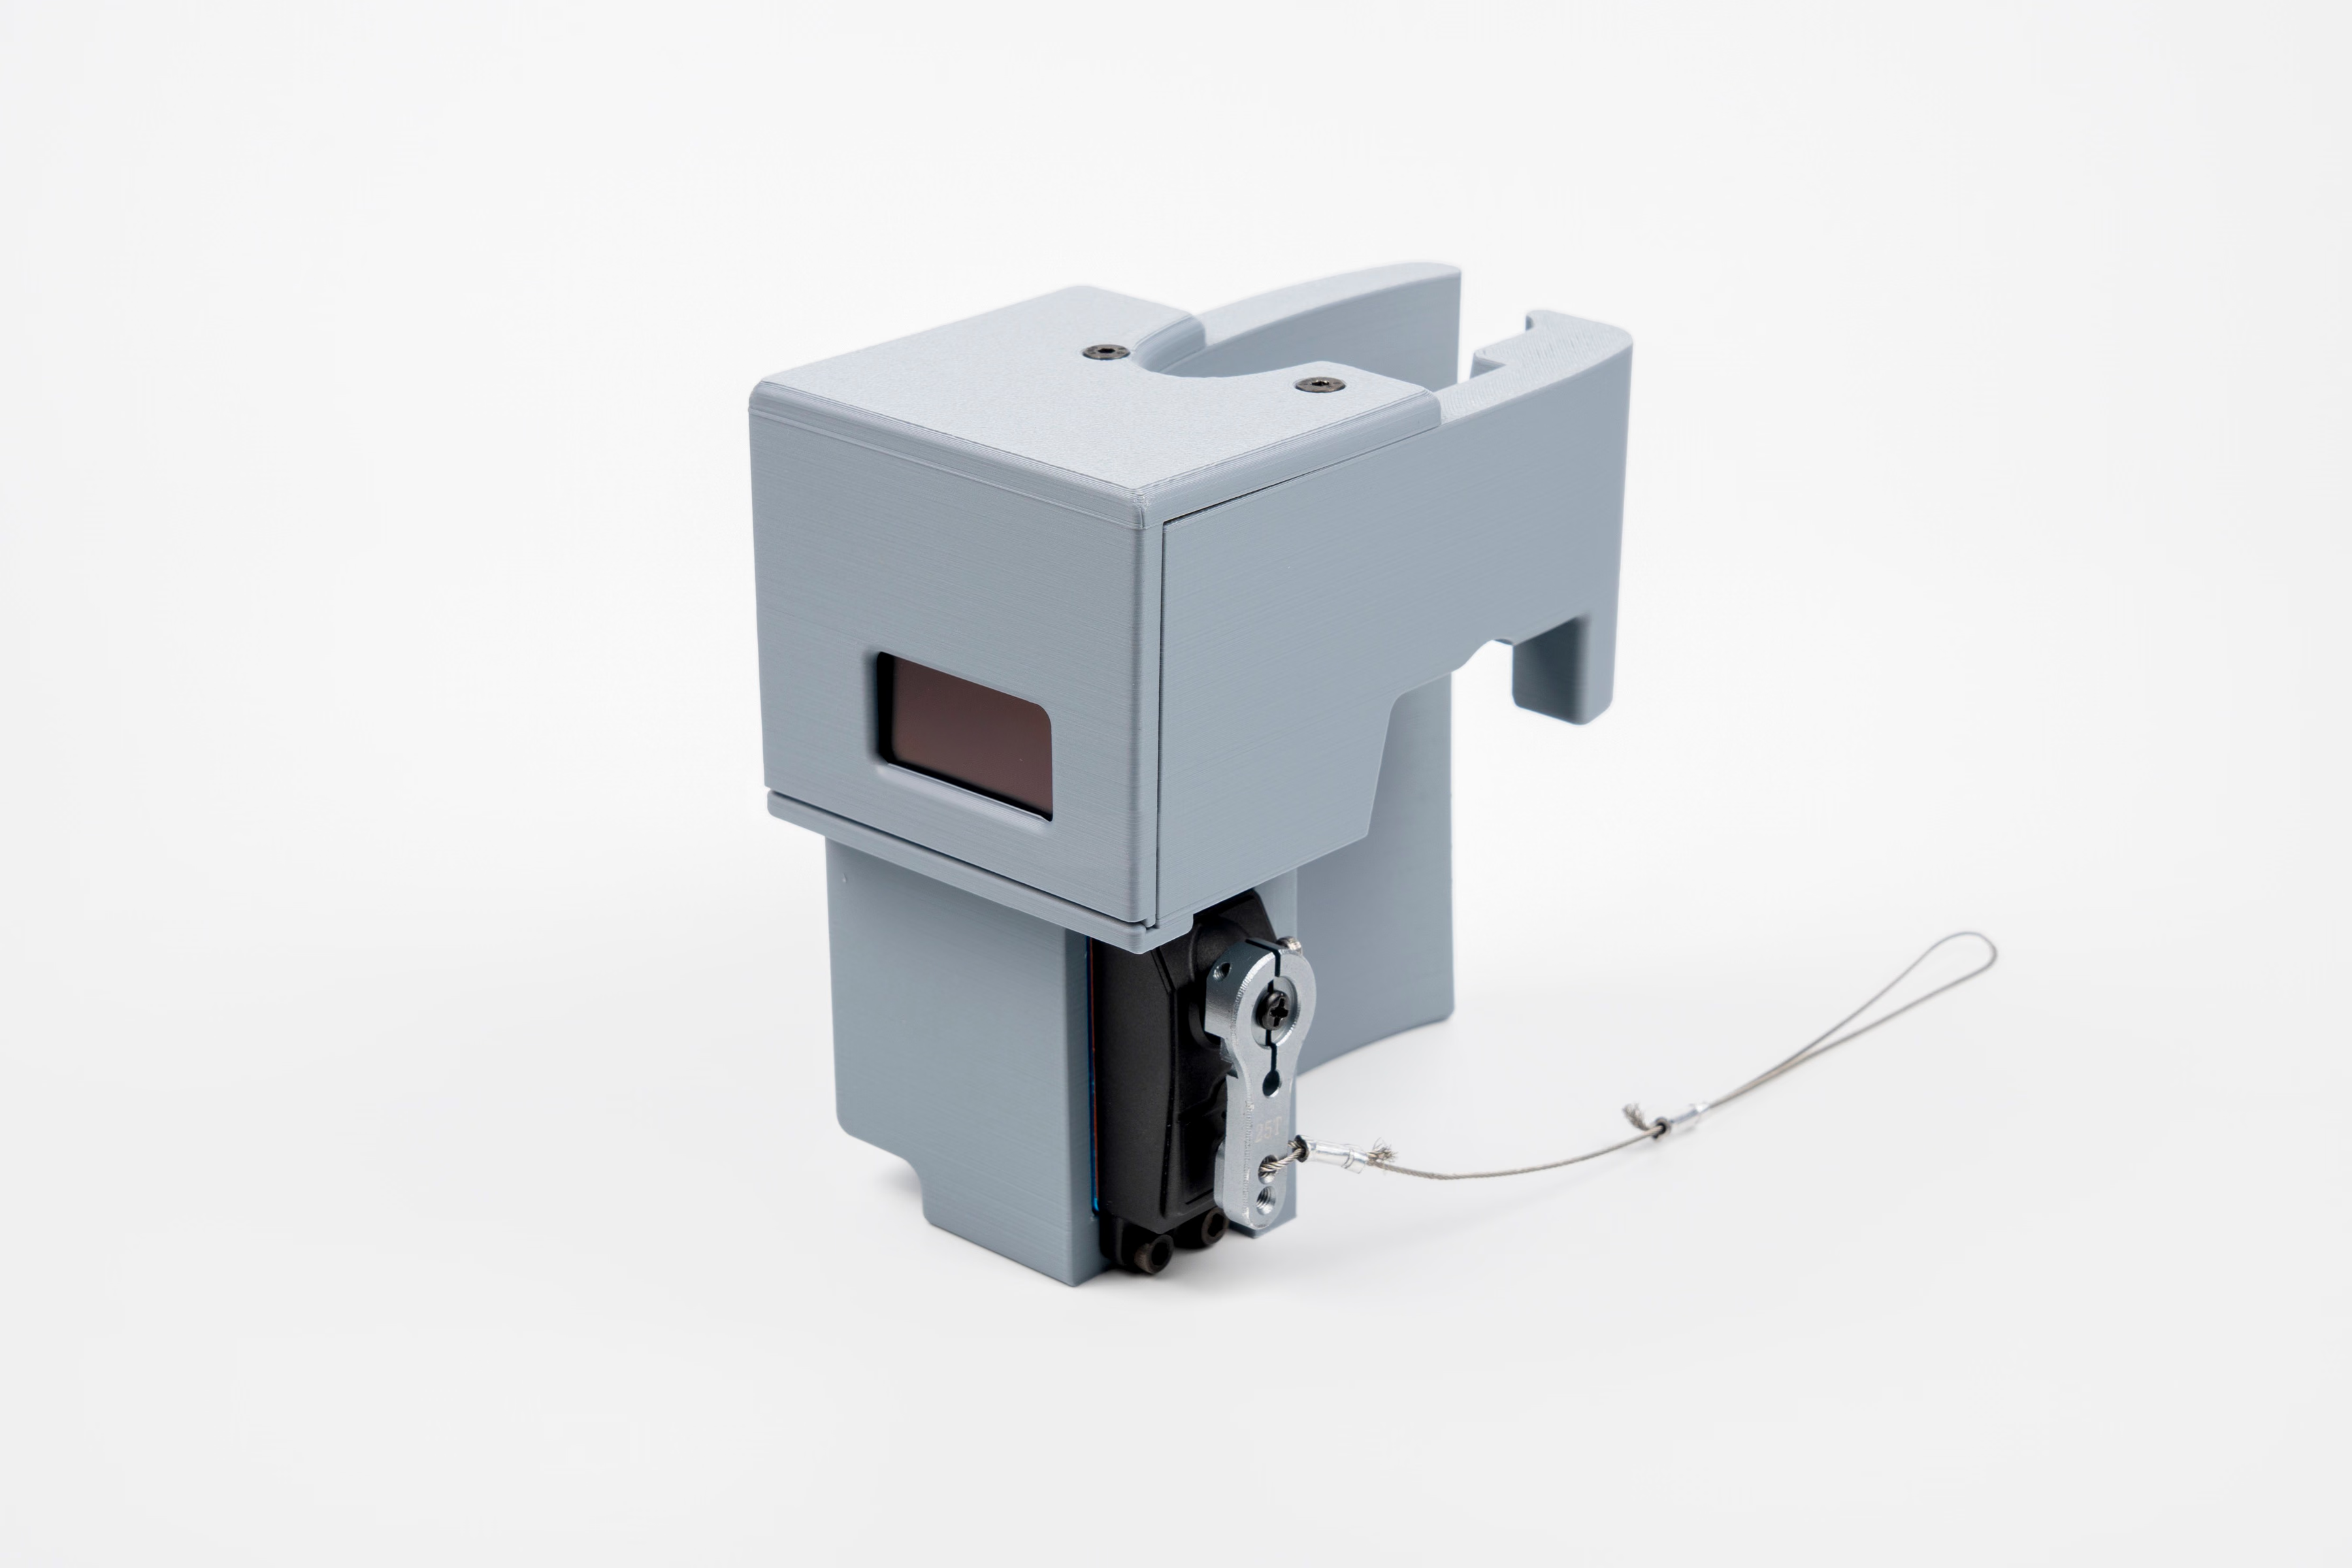
The servo is connected to the bike’s front brake via small wire, applying tension the same way the front brake lever does. In areas with greater housing pressure, it applies more resistance; in more affordable areas, it releases that tension. One of the main technical challenges was calibrating this relationship so that the changes were physically noticeable without feeling abrupt or unsafe. The system needed to respond to the data while still producing a continuous, rideable experience. A core design principle was to create an enclosure that was small enough to house all of the components discreetly, and to quickly attach to a bike while it’s docked, without any additional hardware.


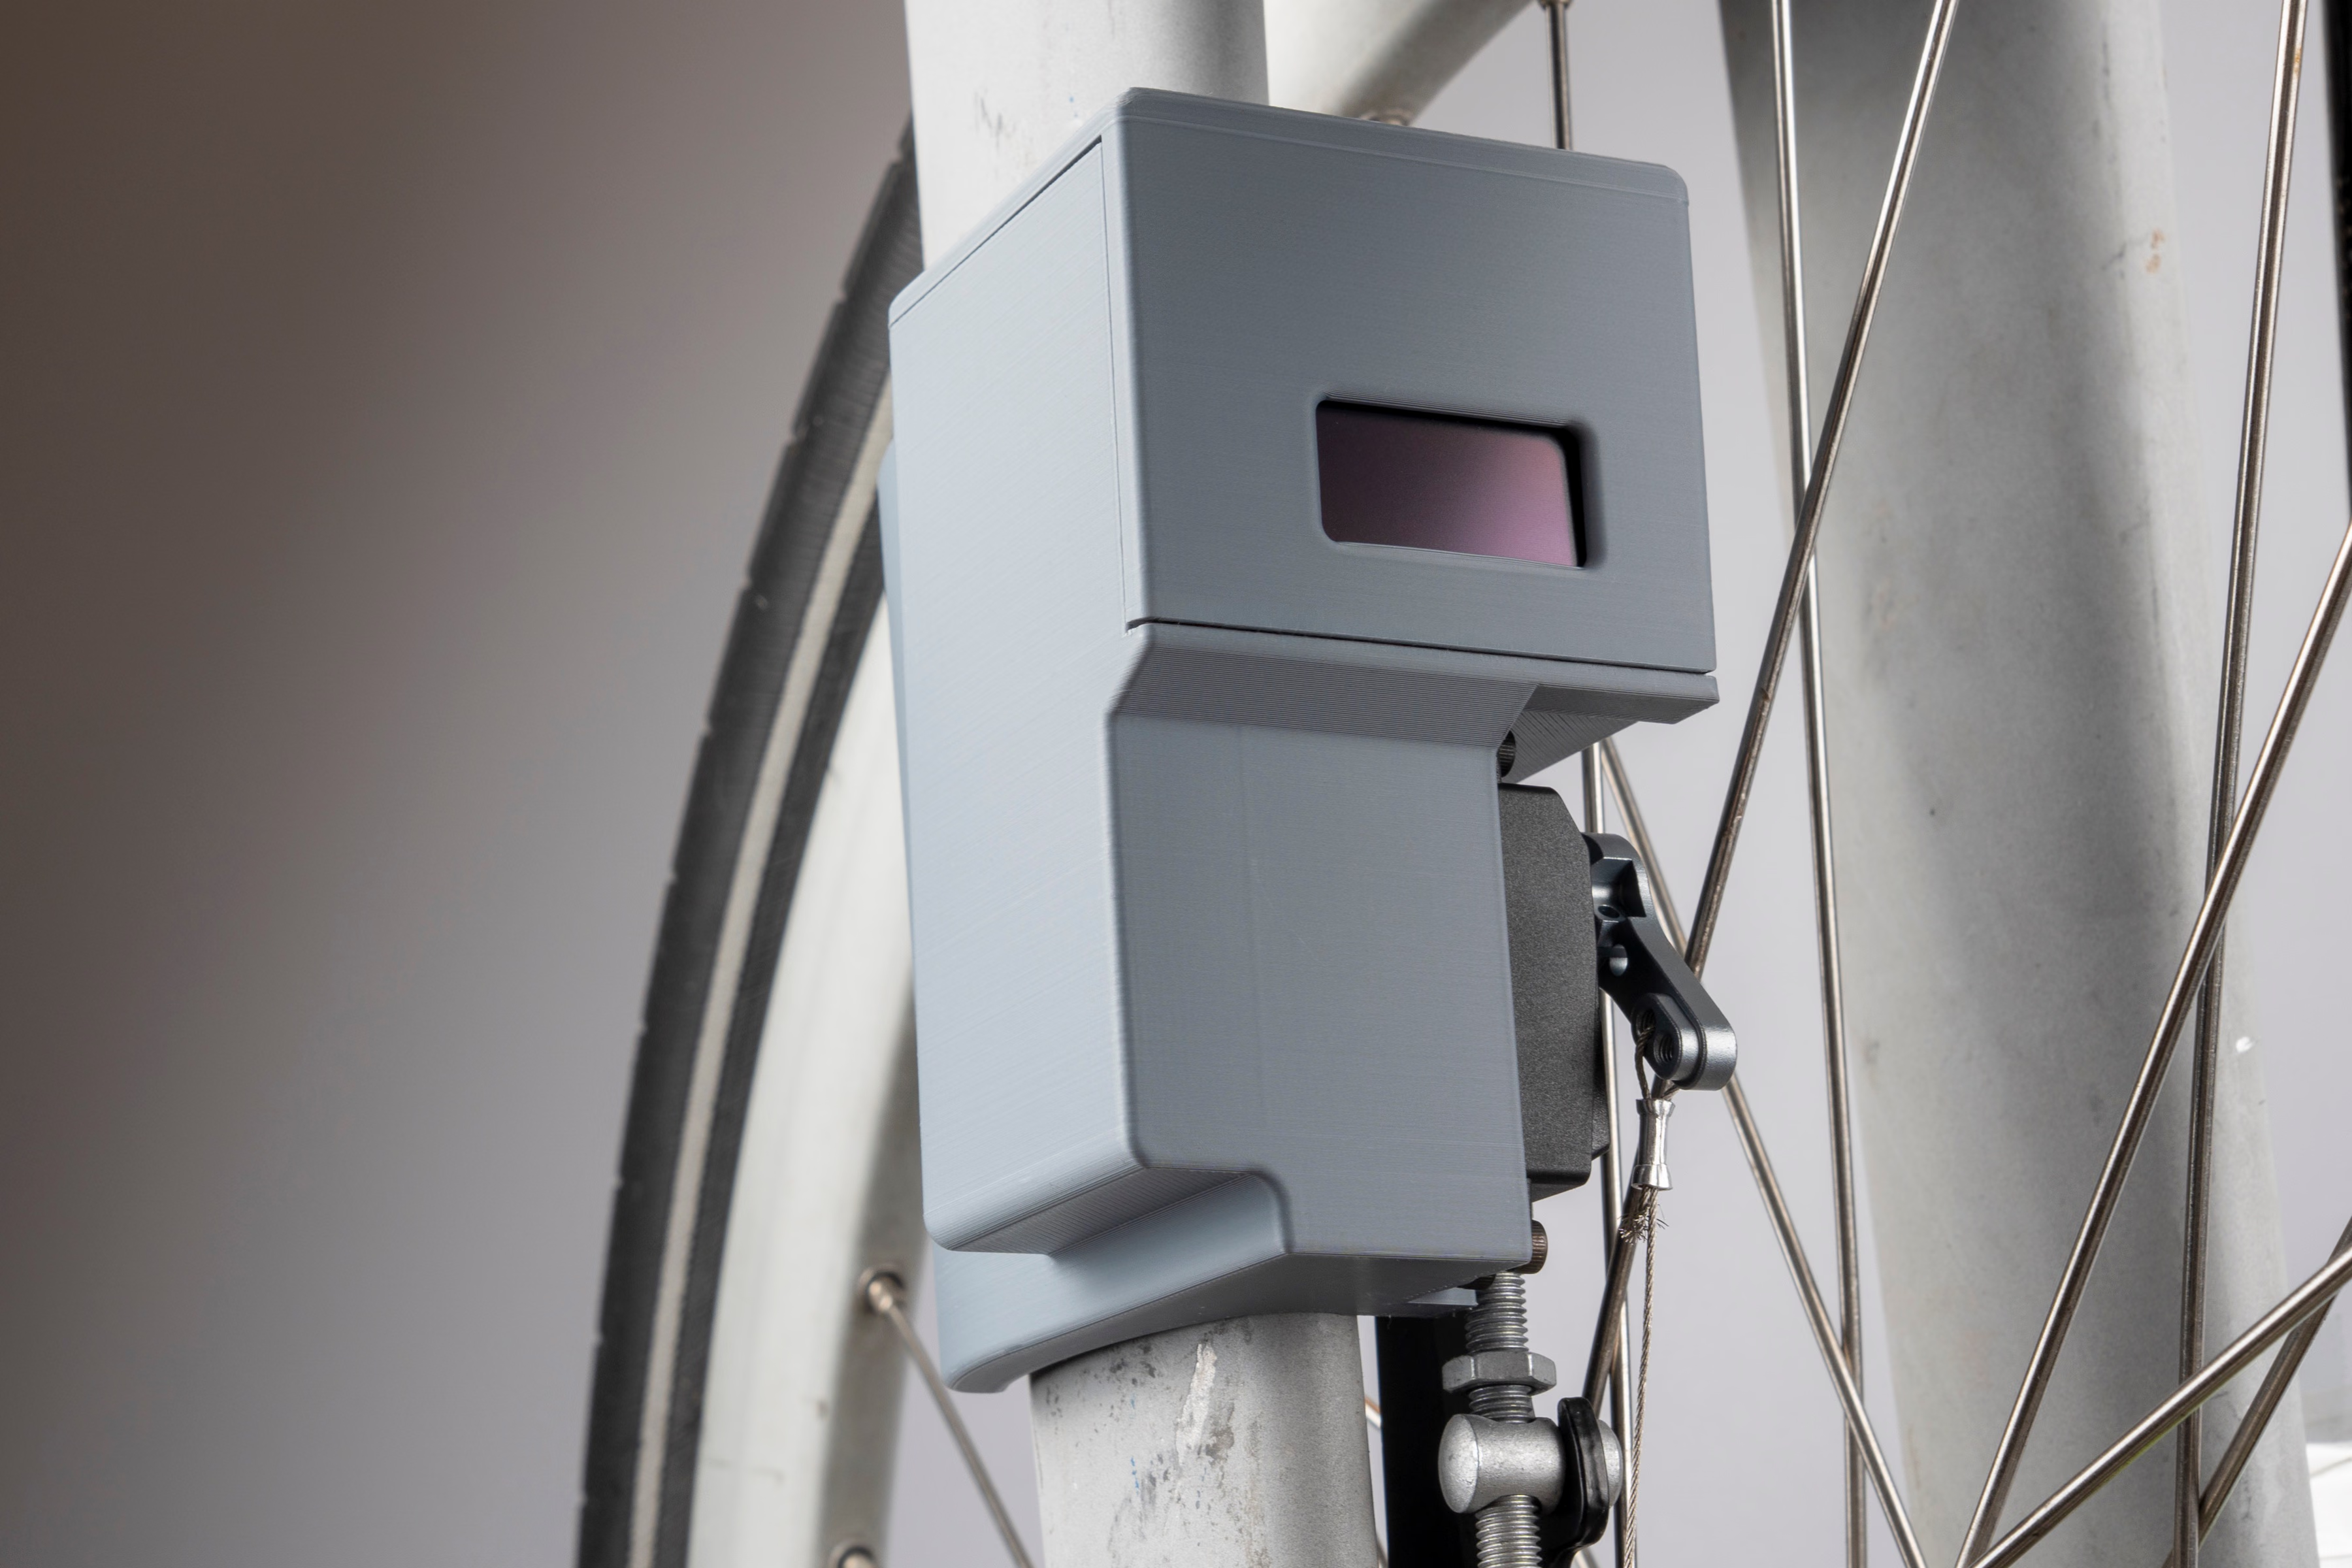
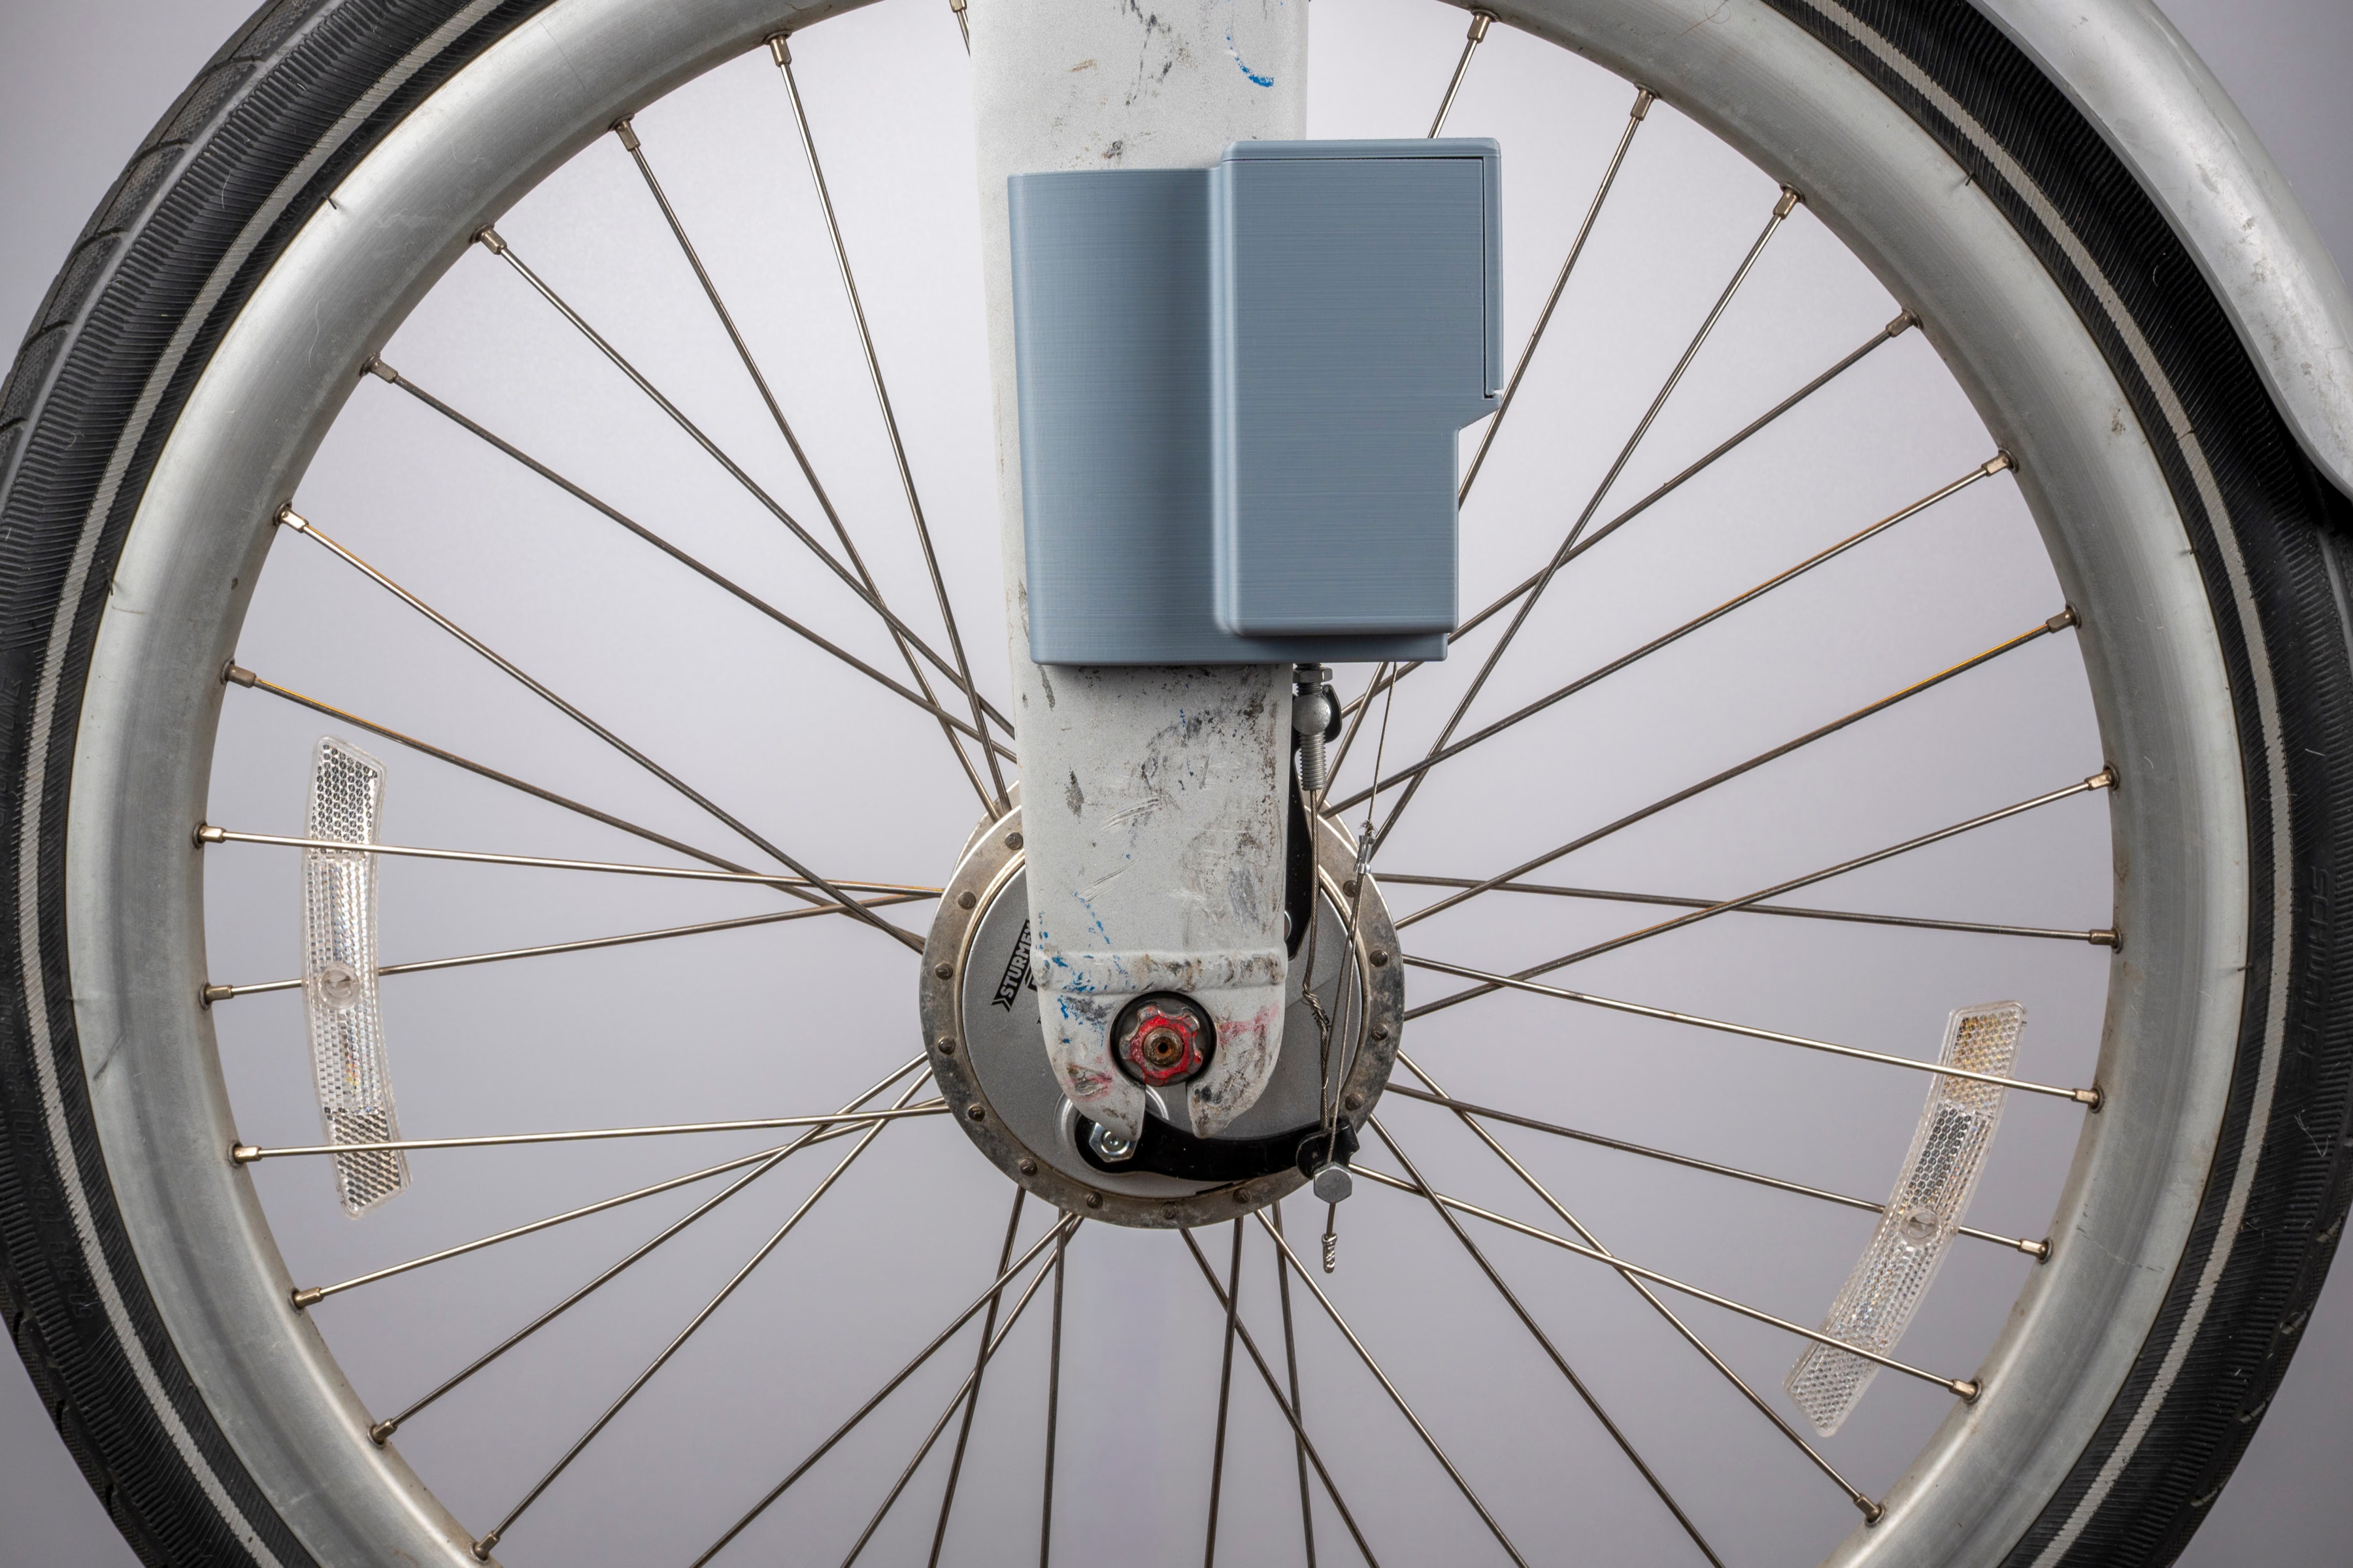
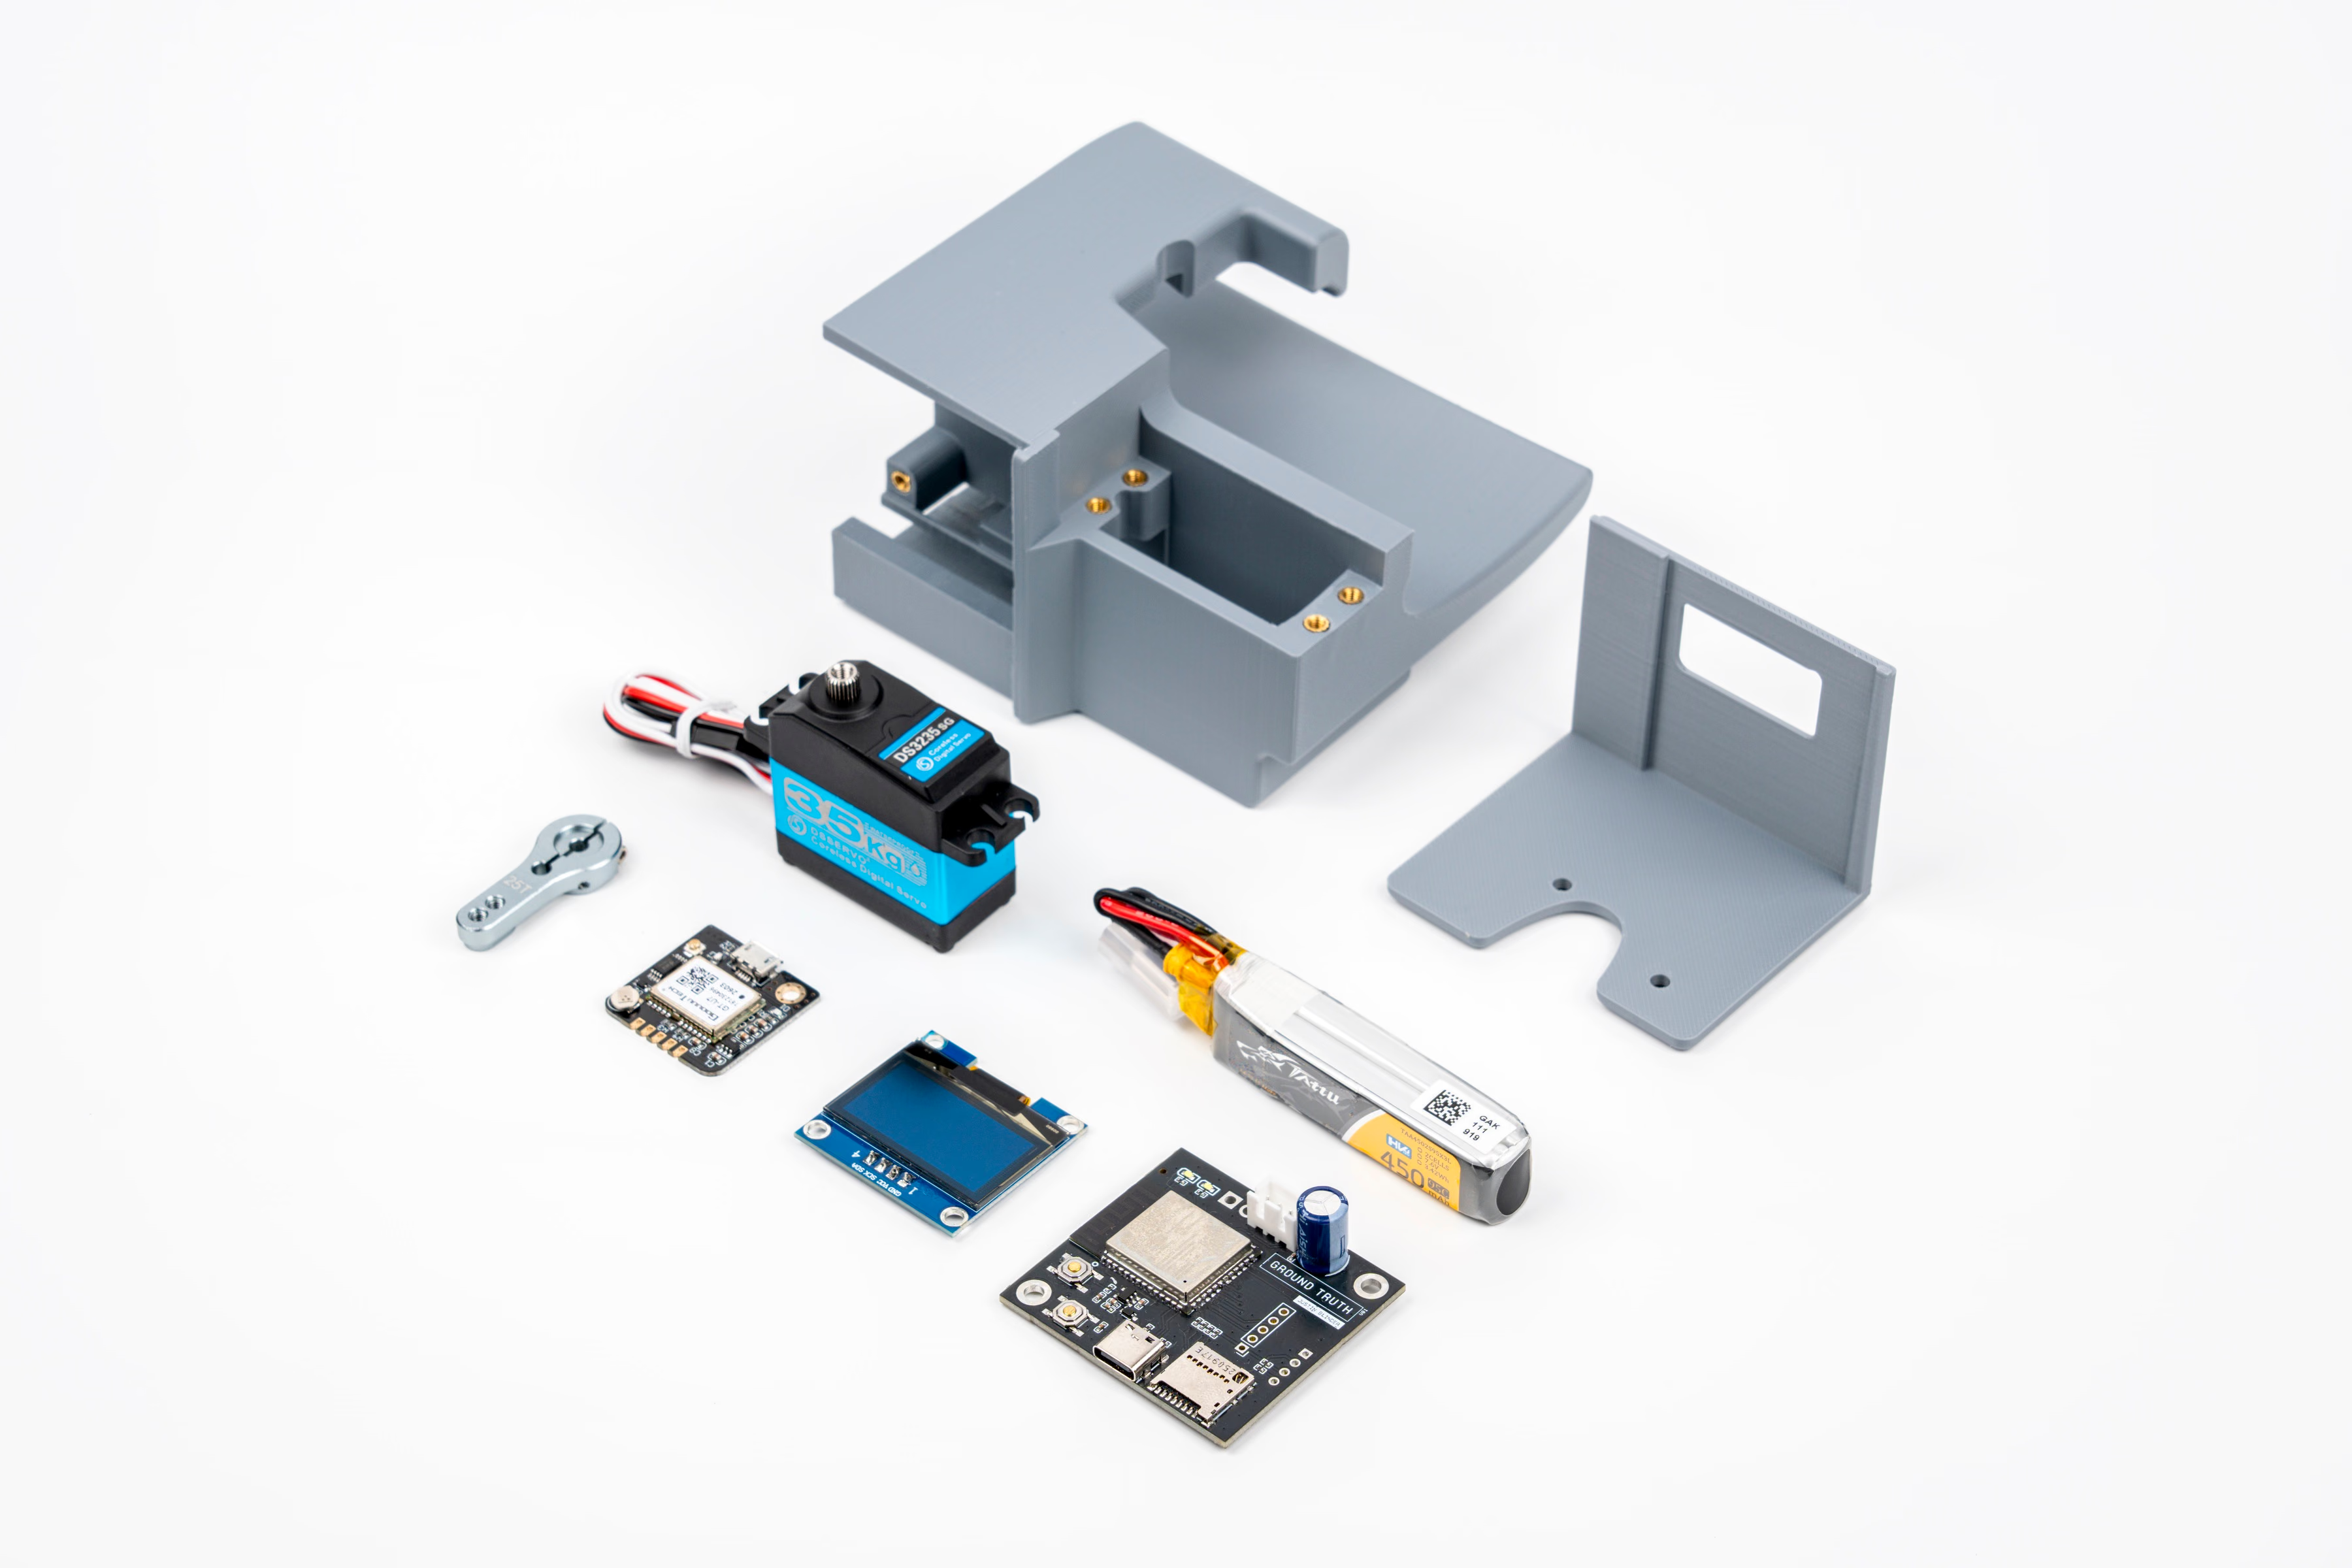
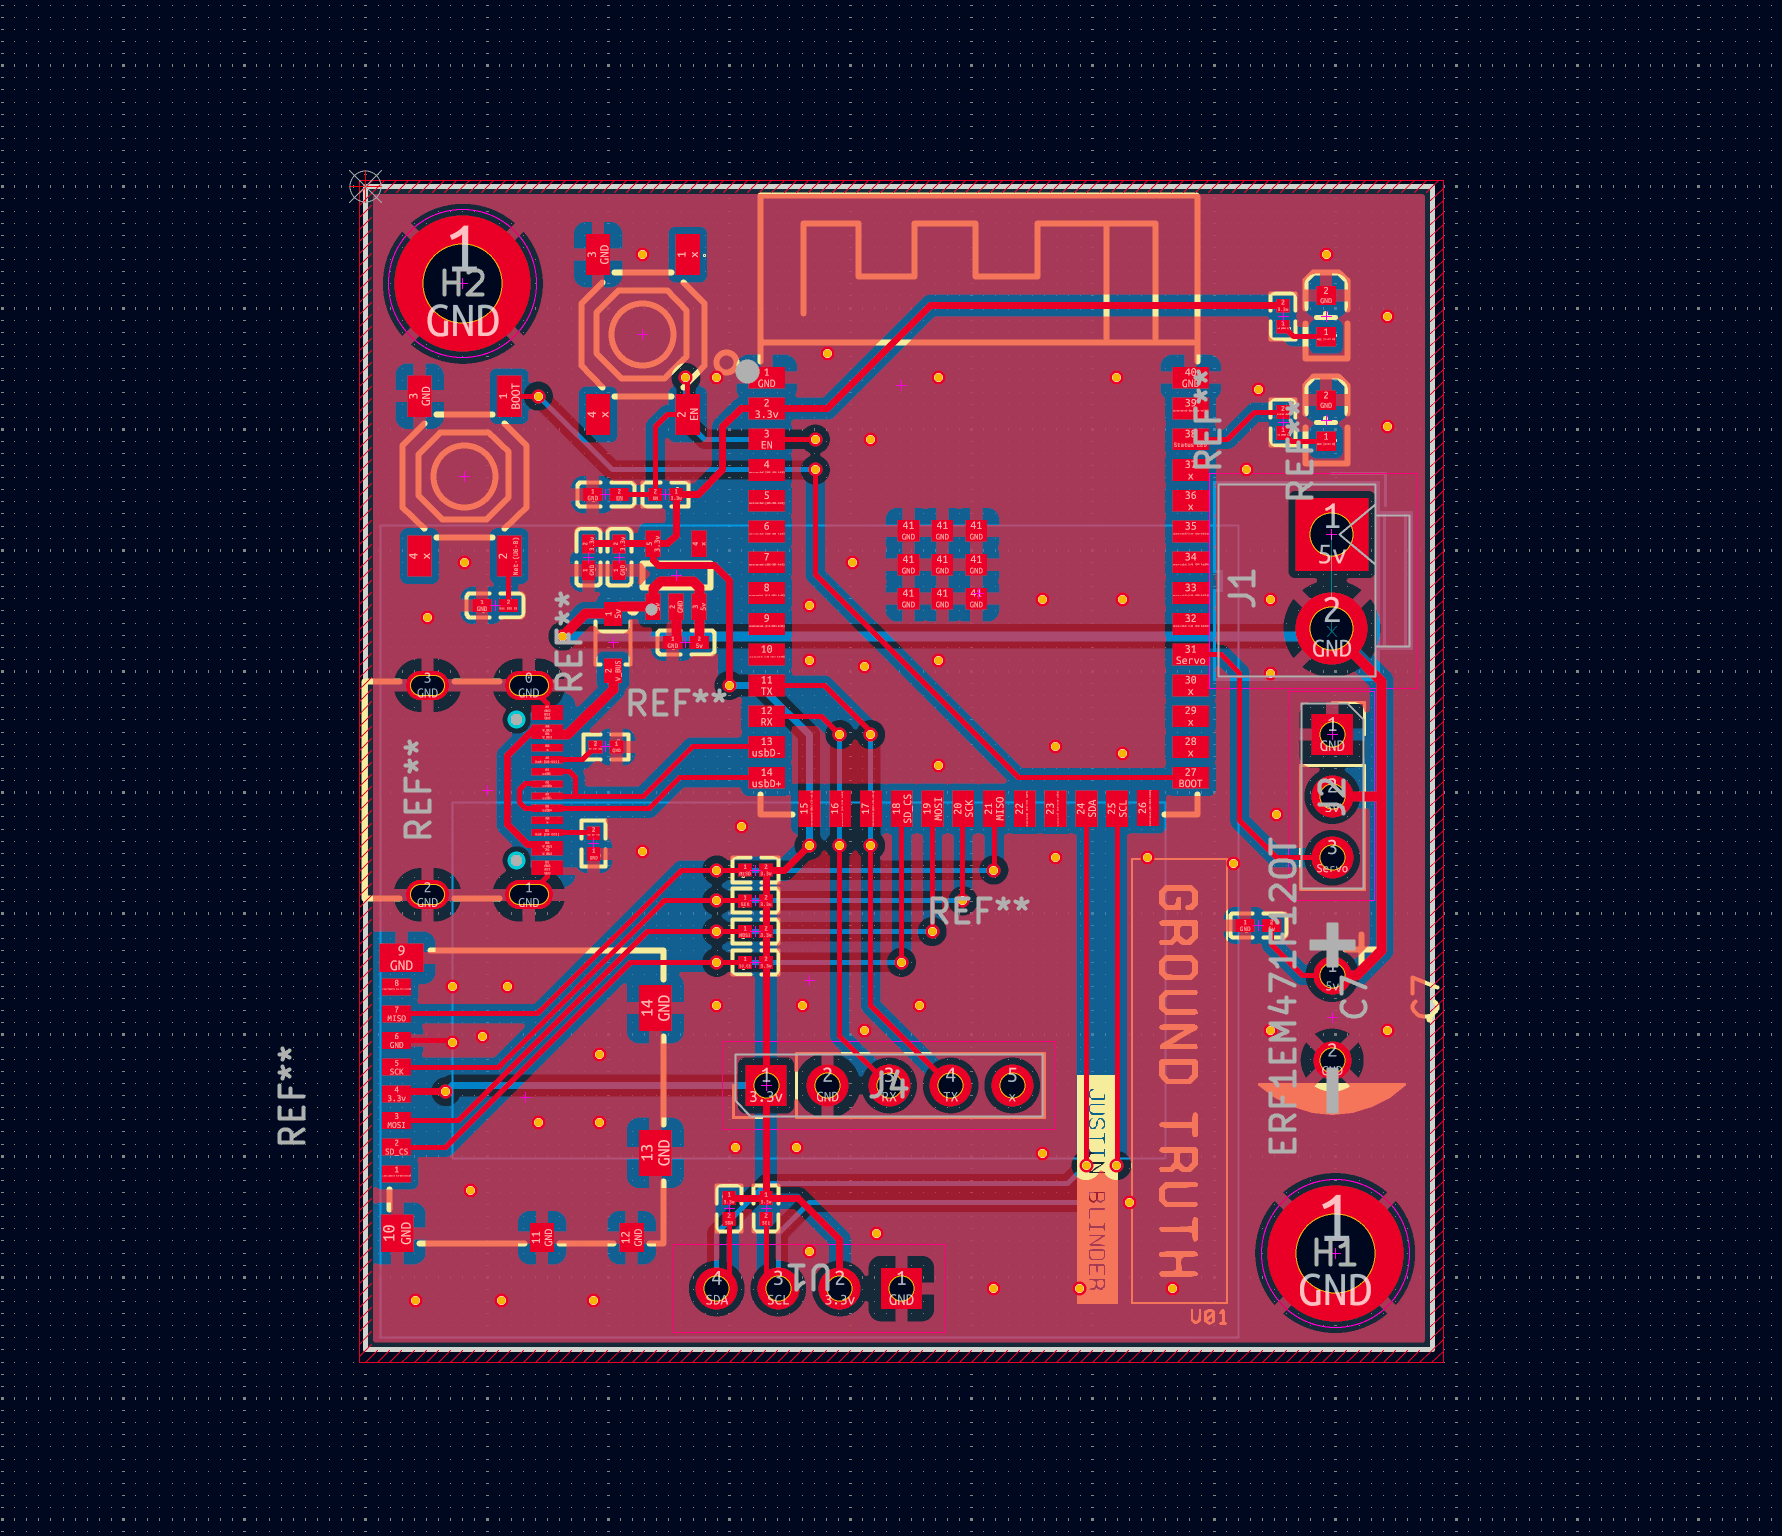
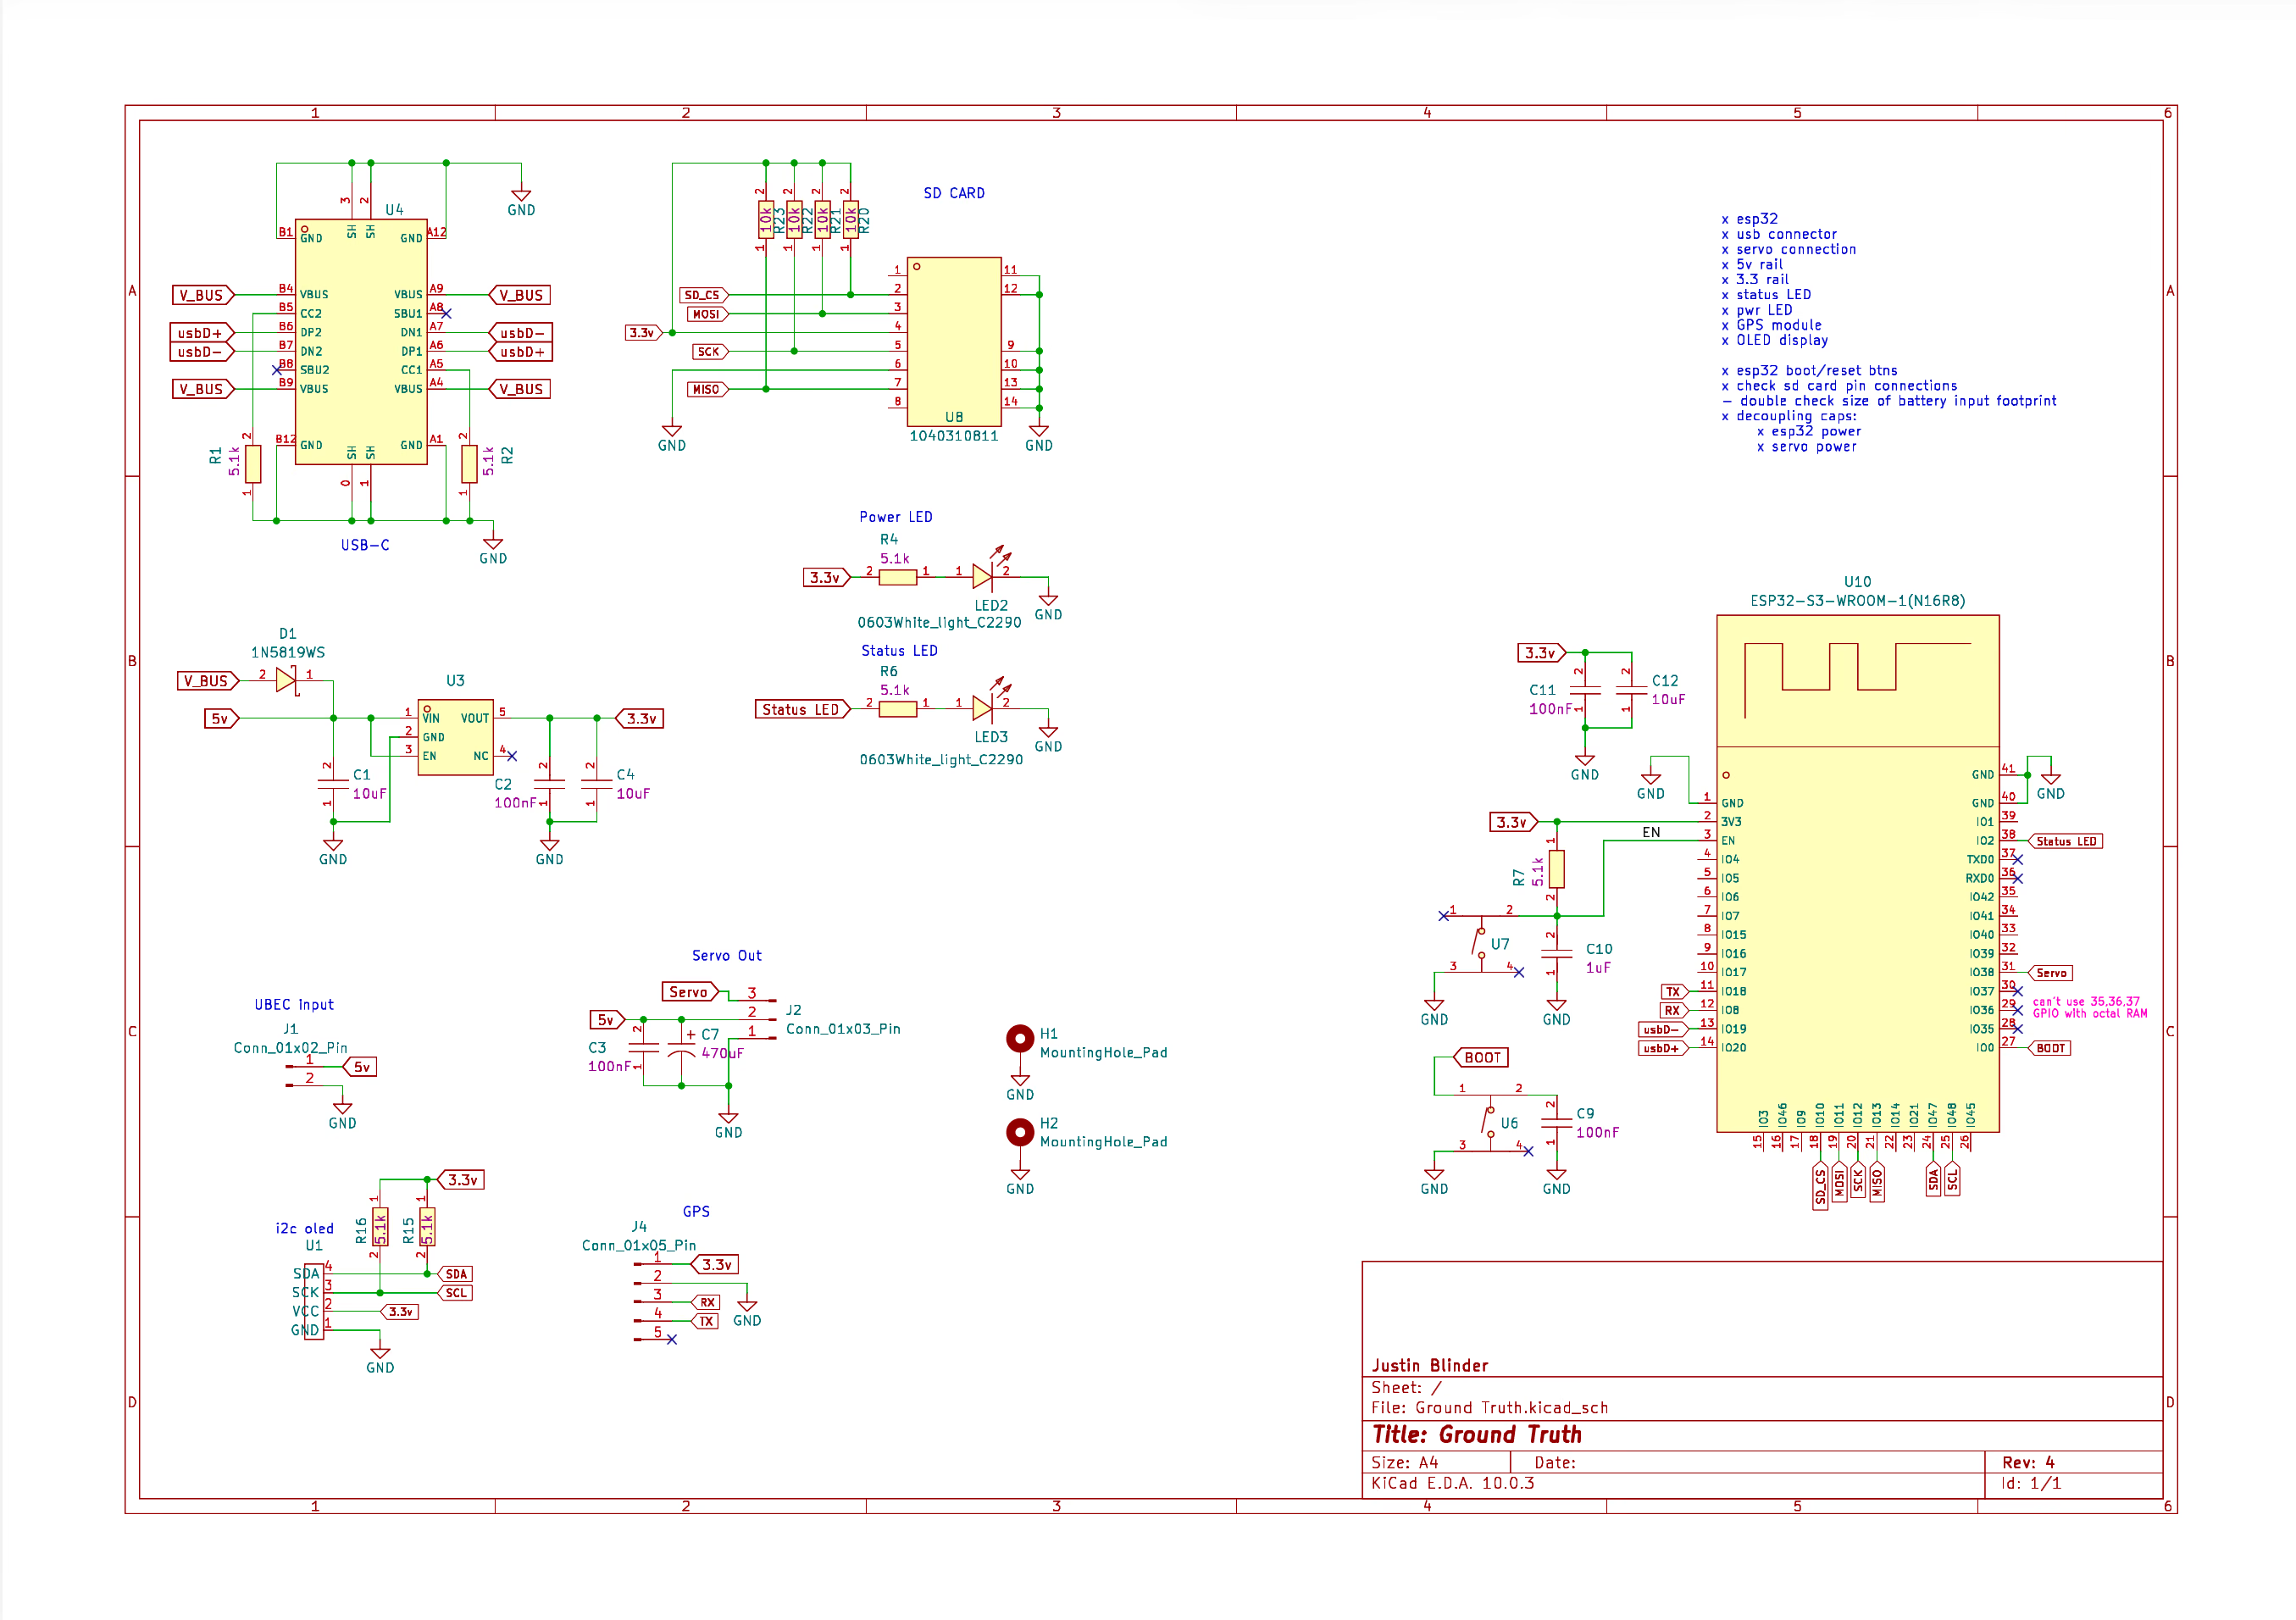
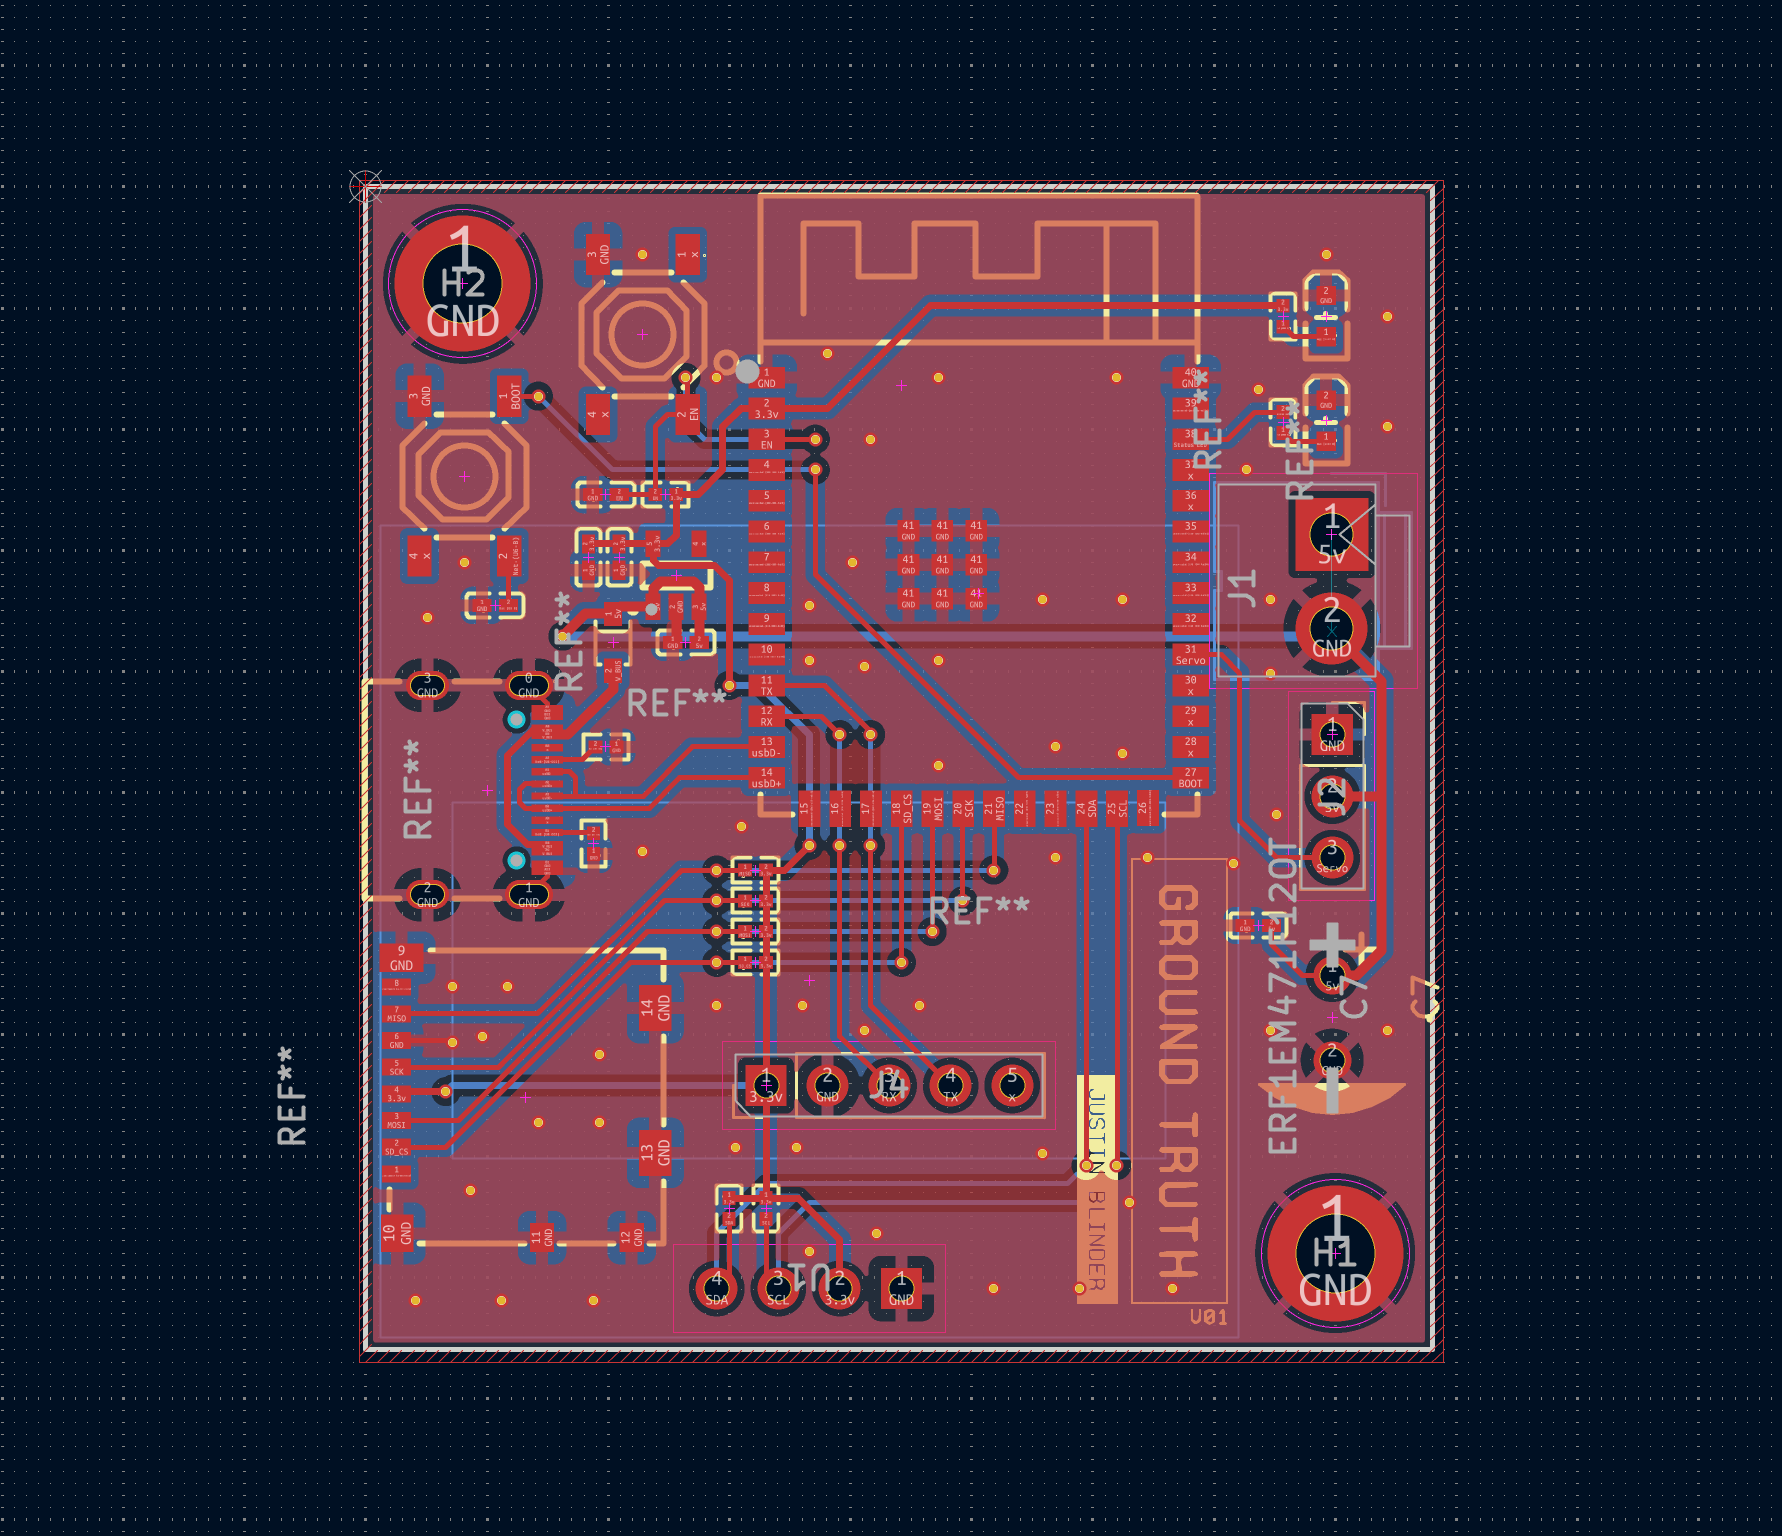
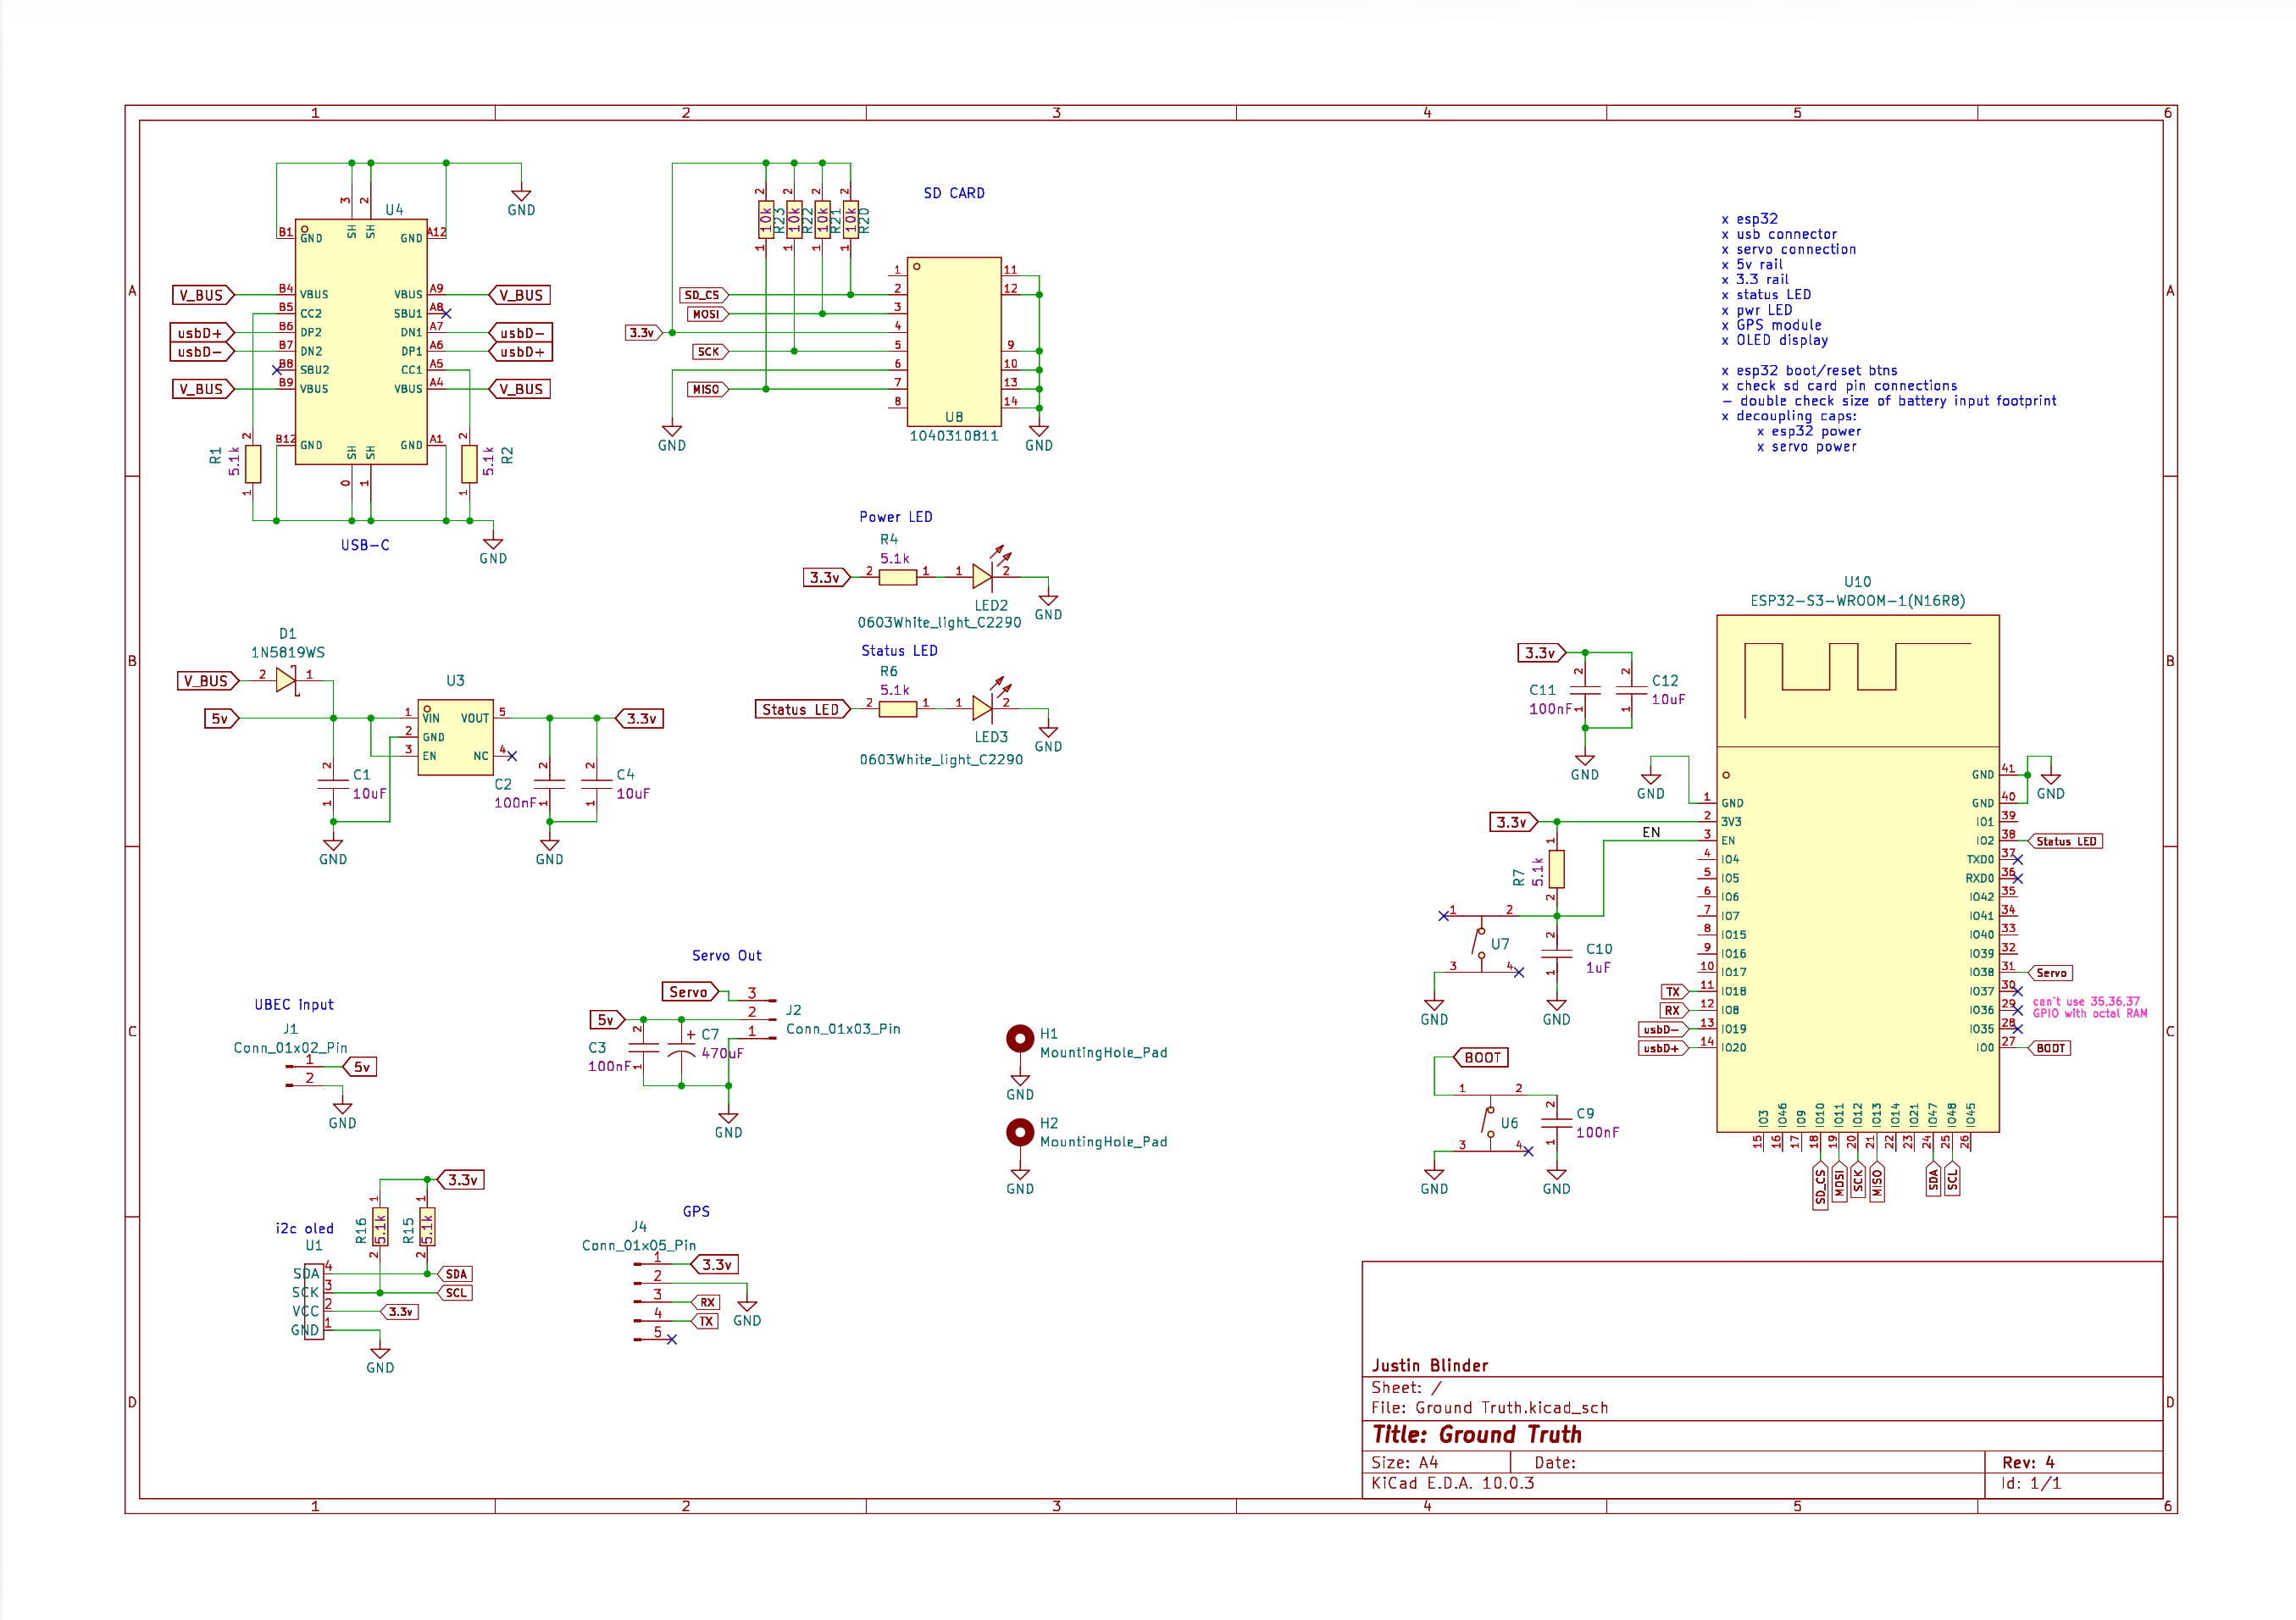
The printed circuit board houses the ESP32S3 microcontroller, GPS module, SD card reader, servo, OLED, and power management. The device does not connect to the internet; all of the data is stored and read locally. No location data is saved in the process.
Press





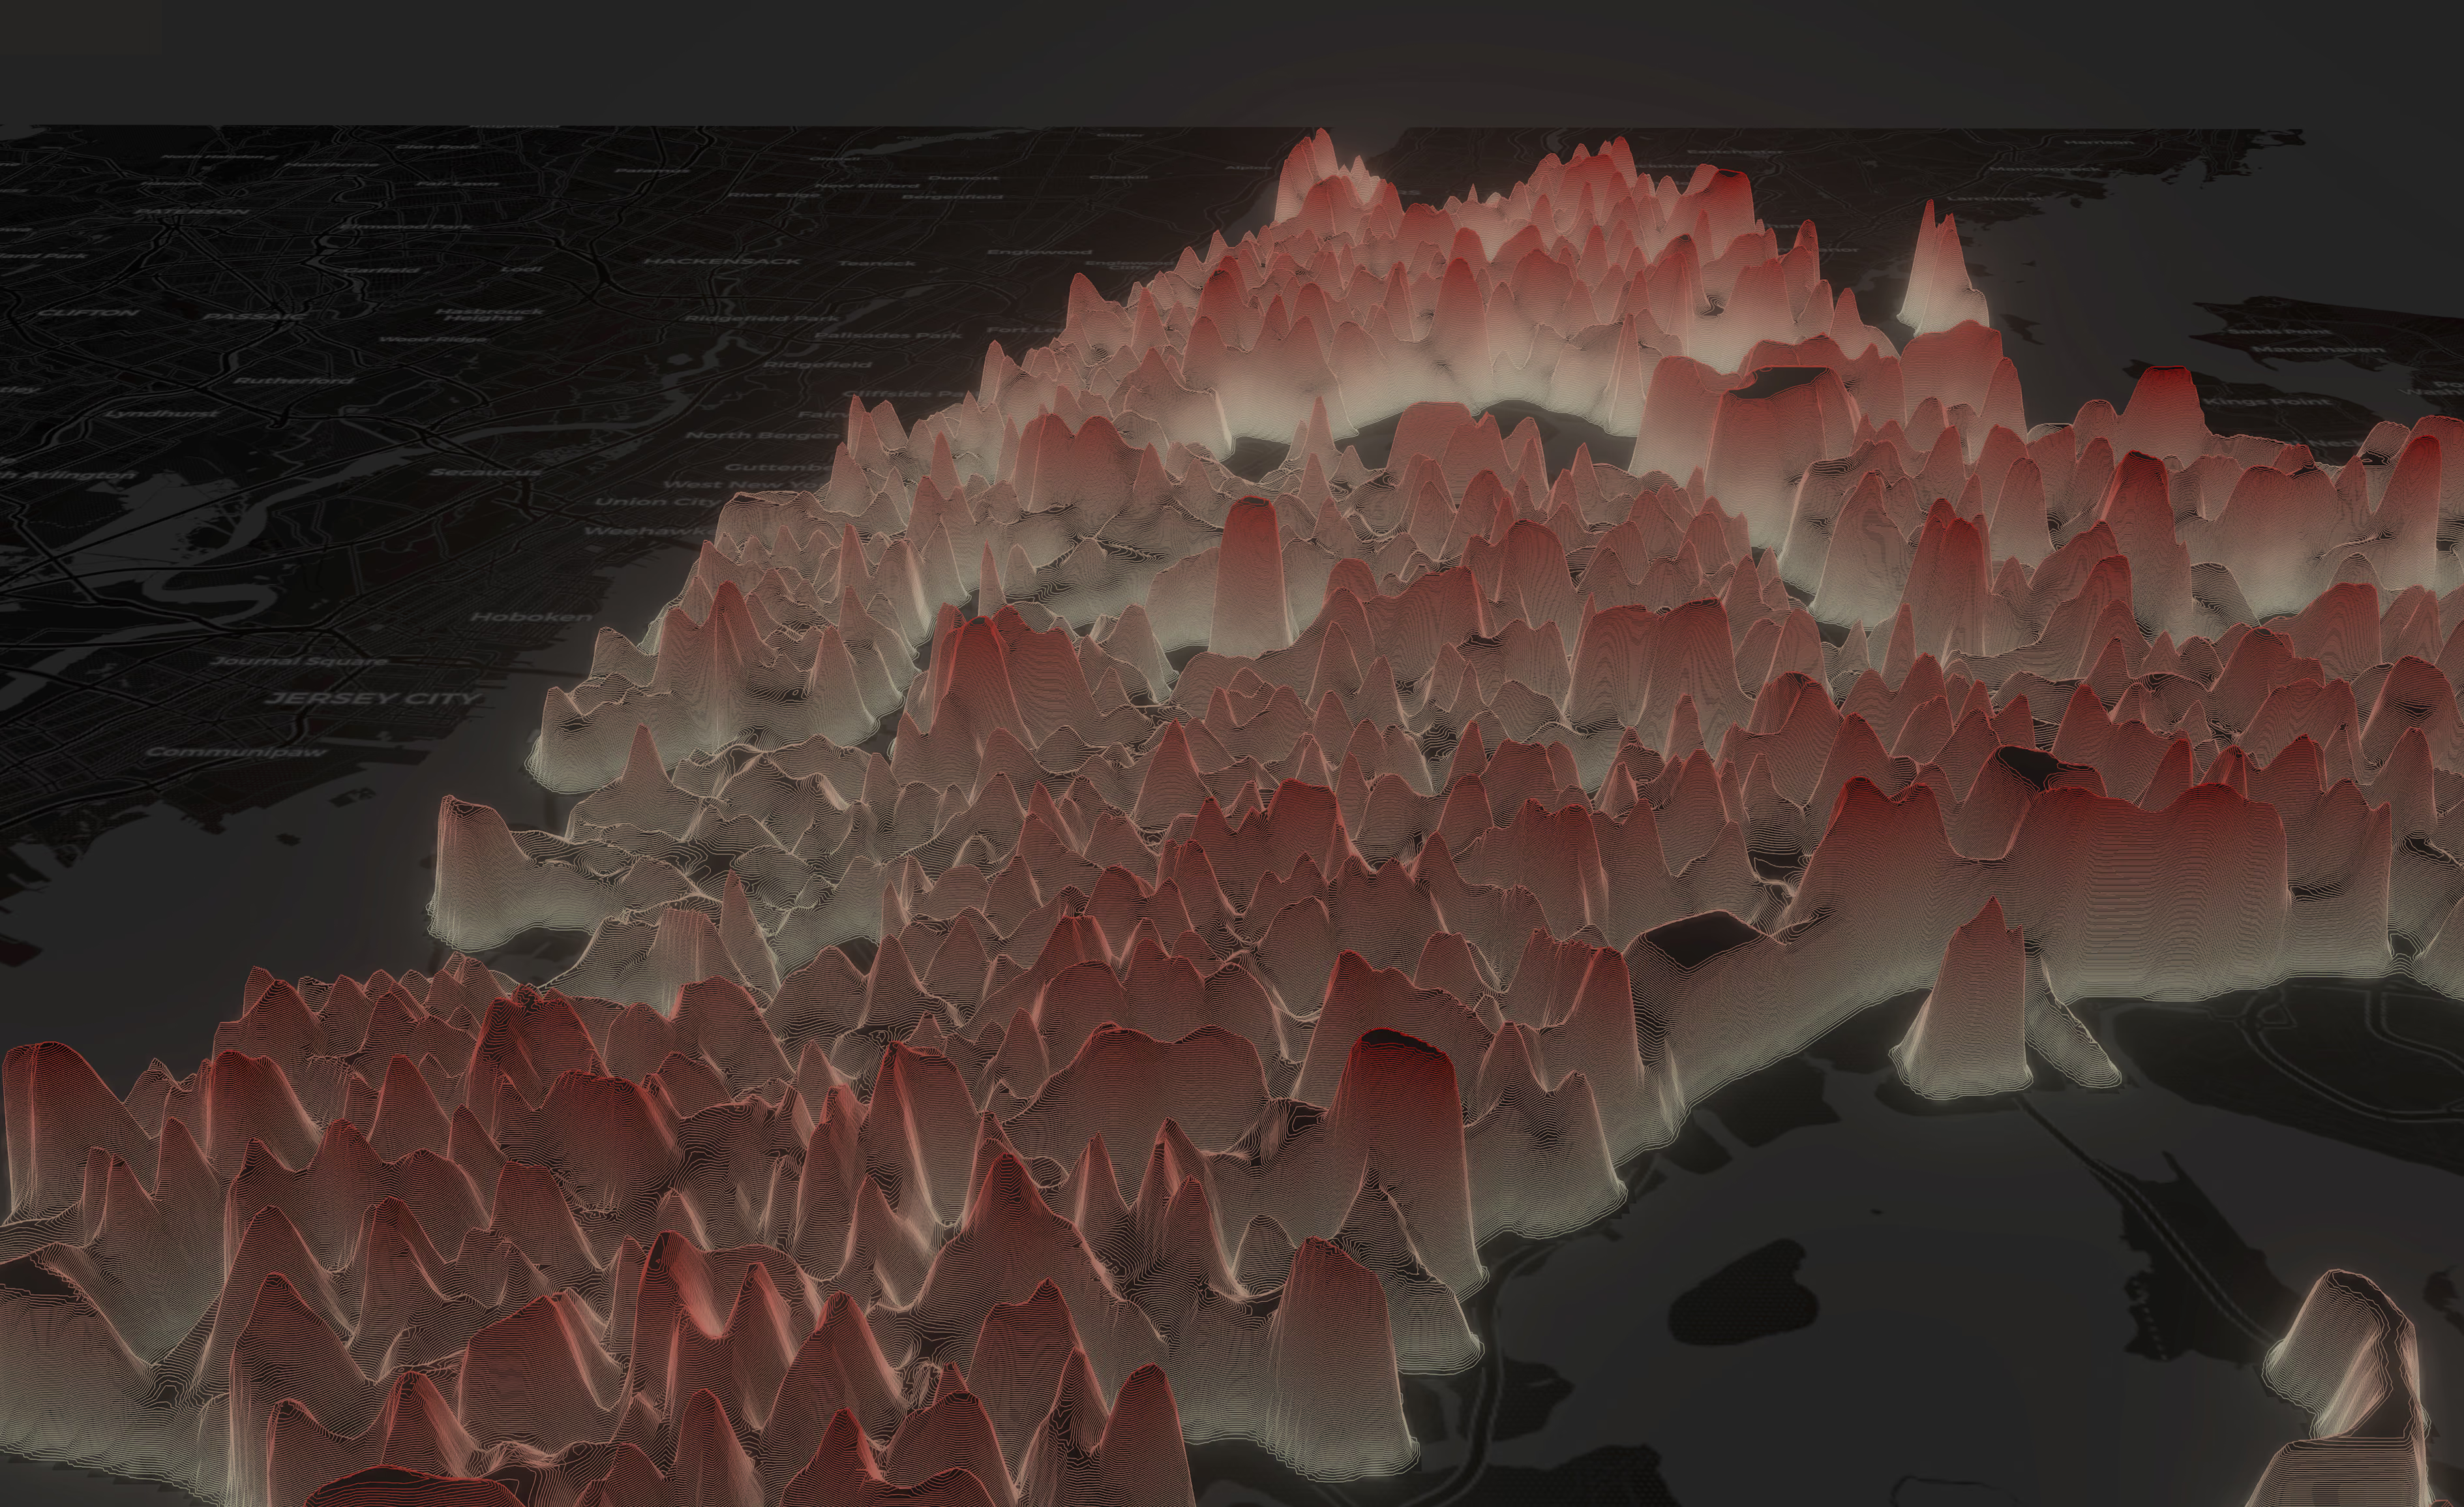
Interactive map — contiguous terrain
New York City rendered as topographic relief, with elevation driven by the blended affordability score.
JPEG · 3778×2310 · 2.1 MB
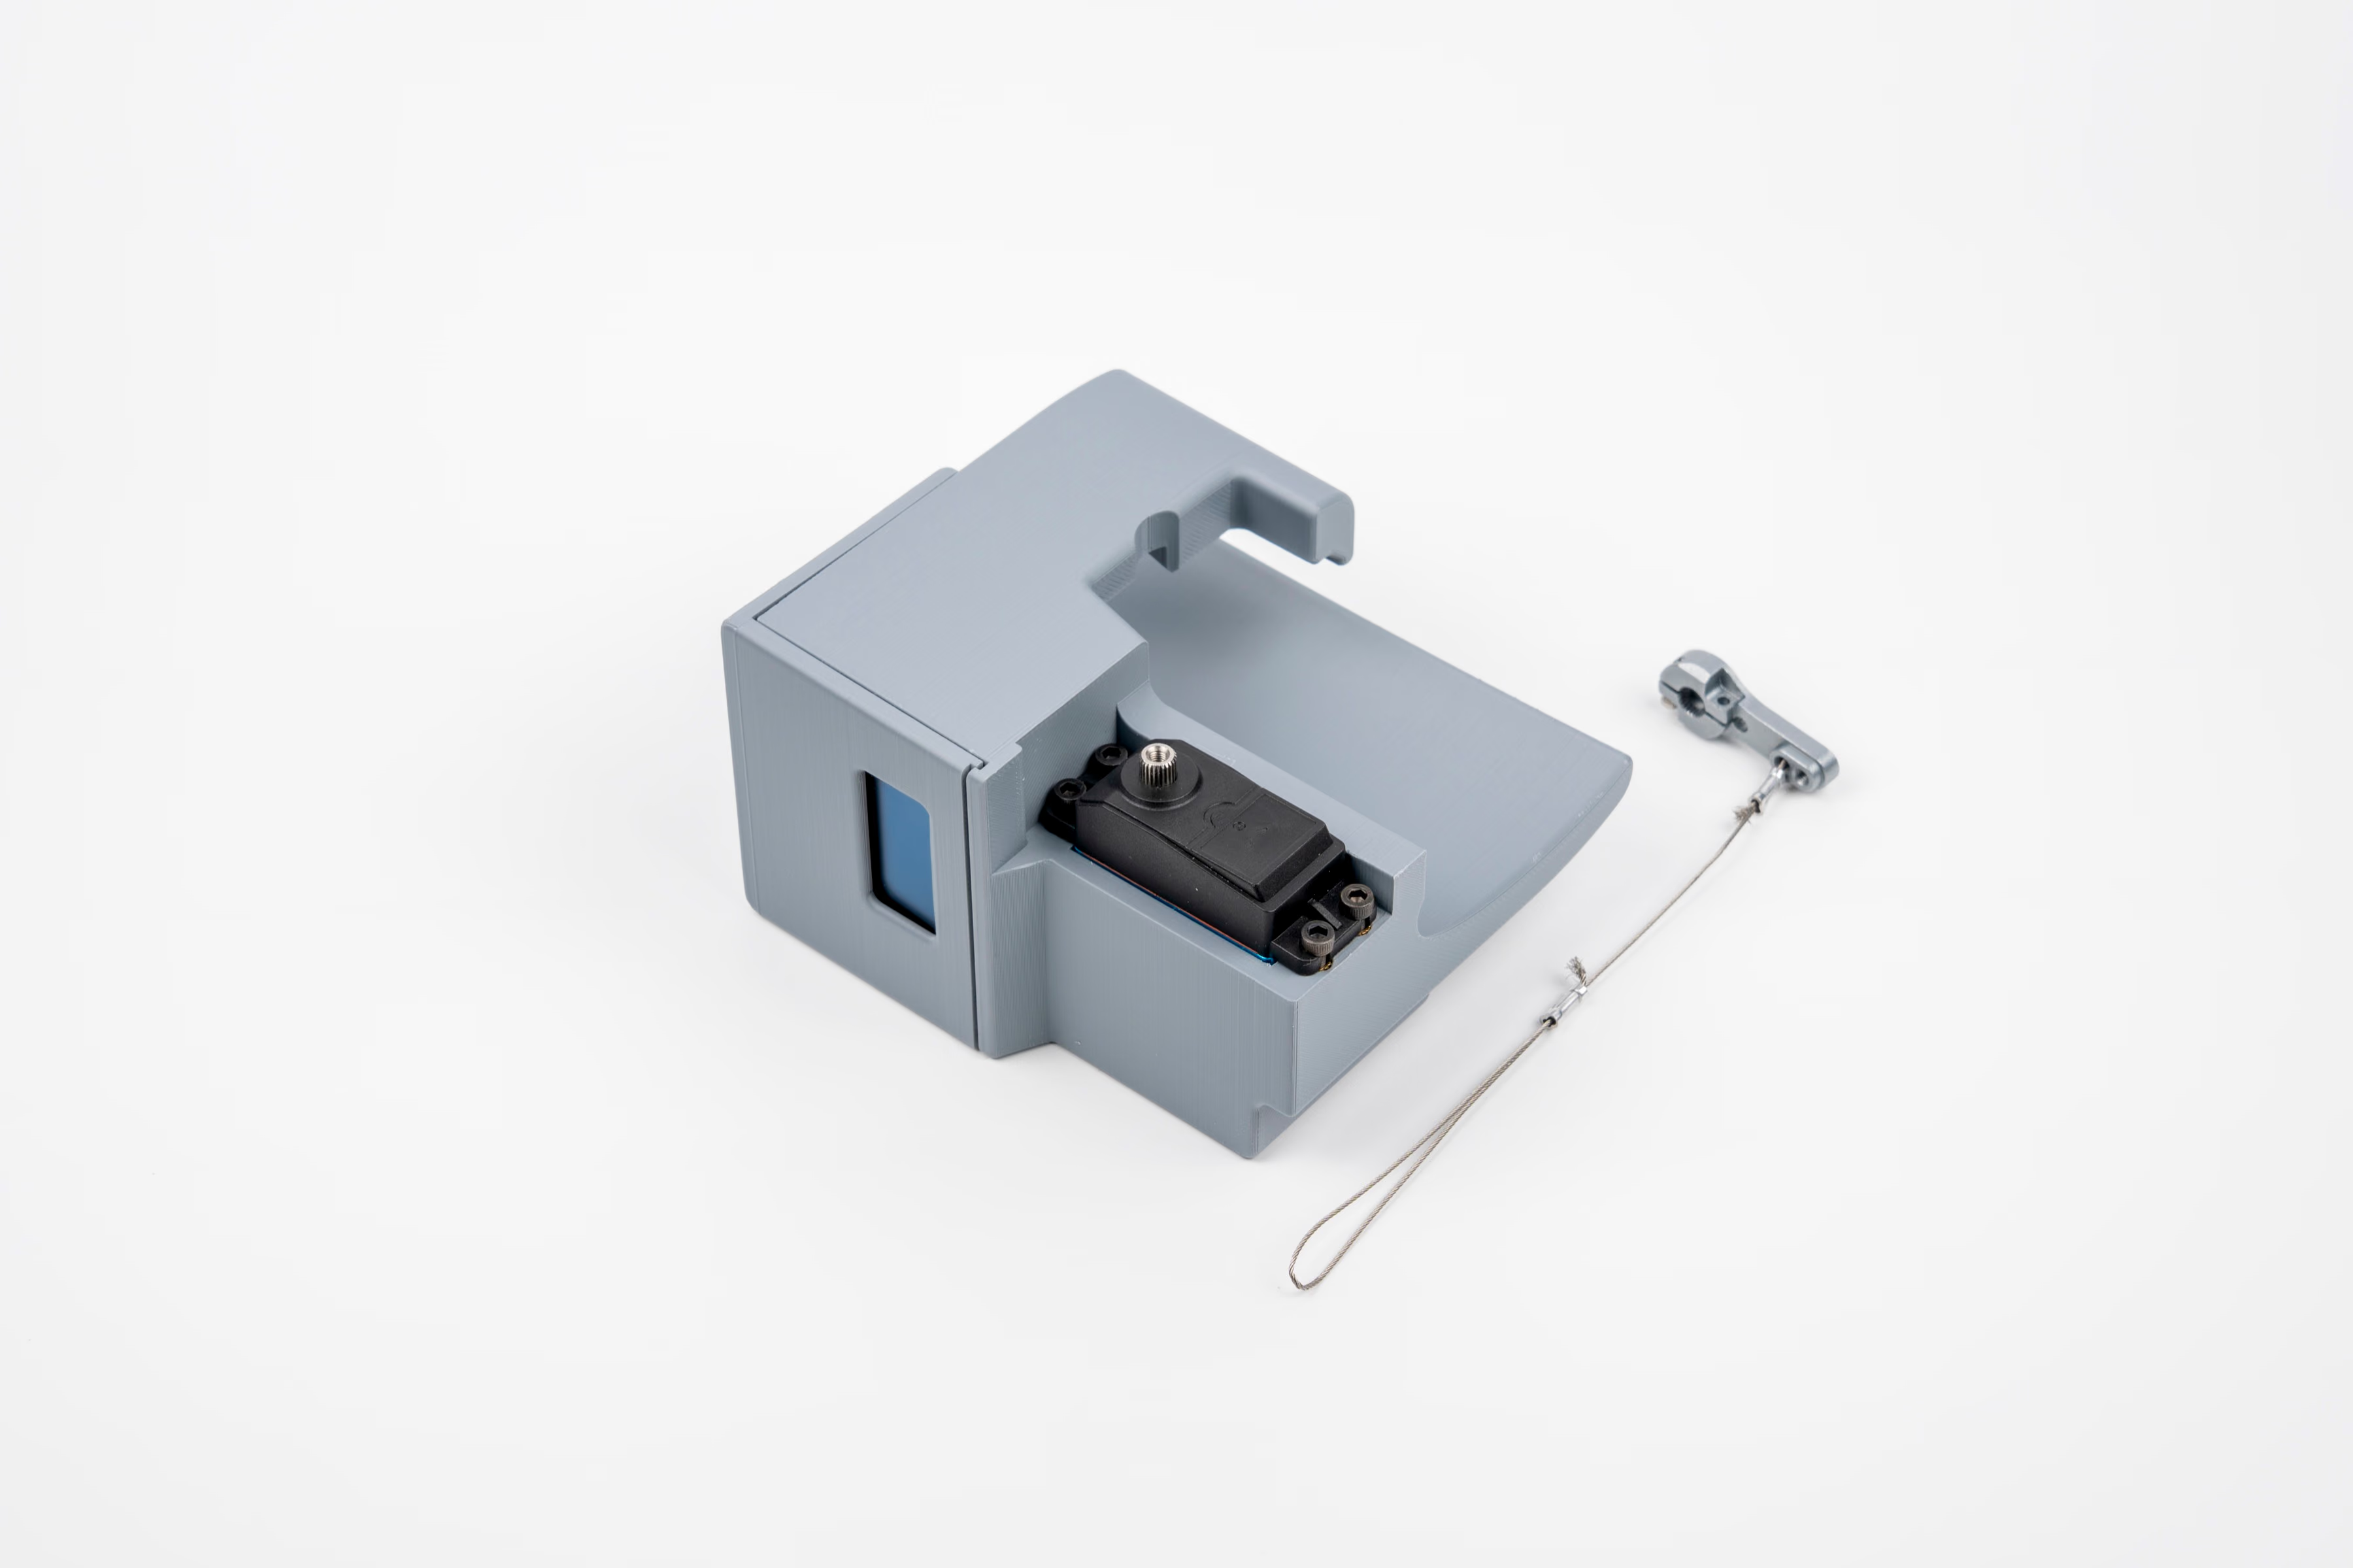
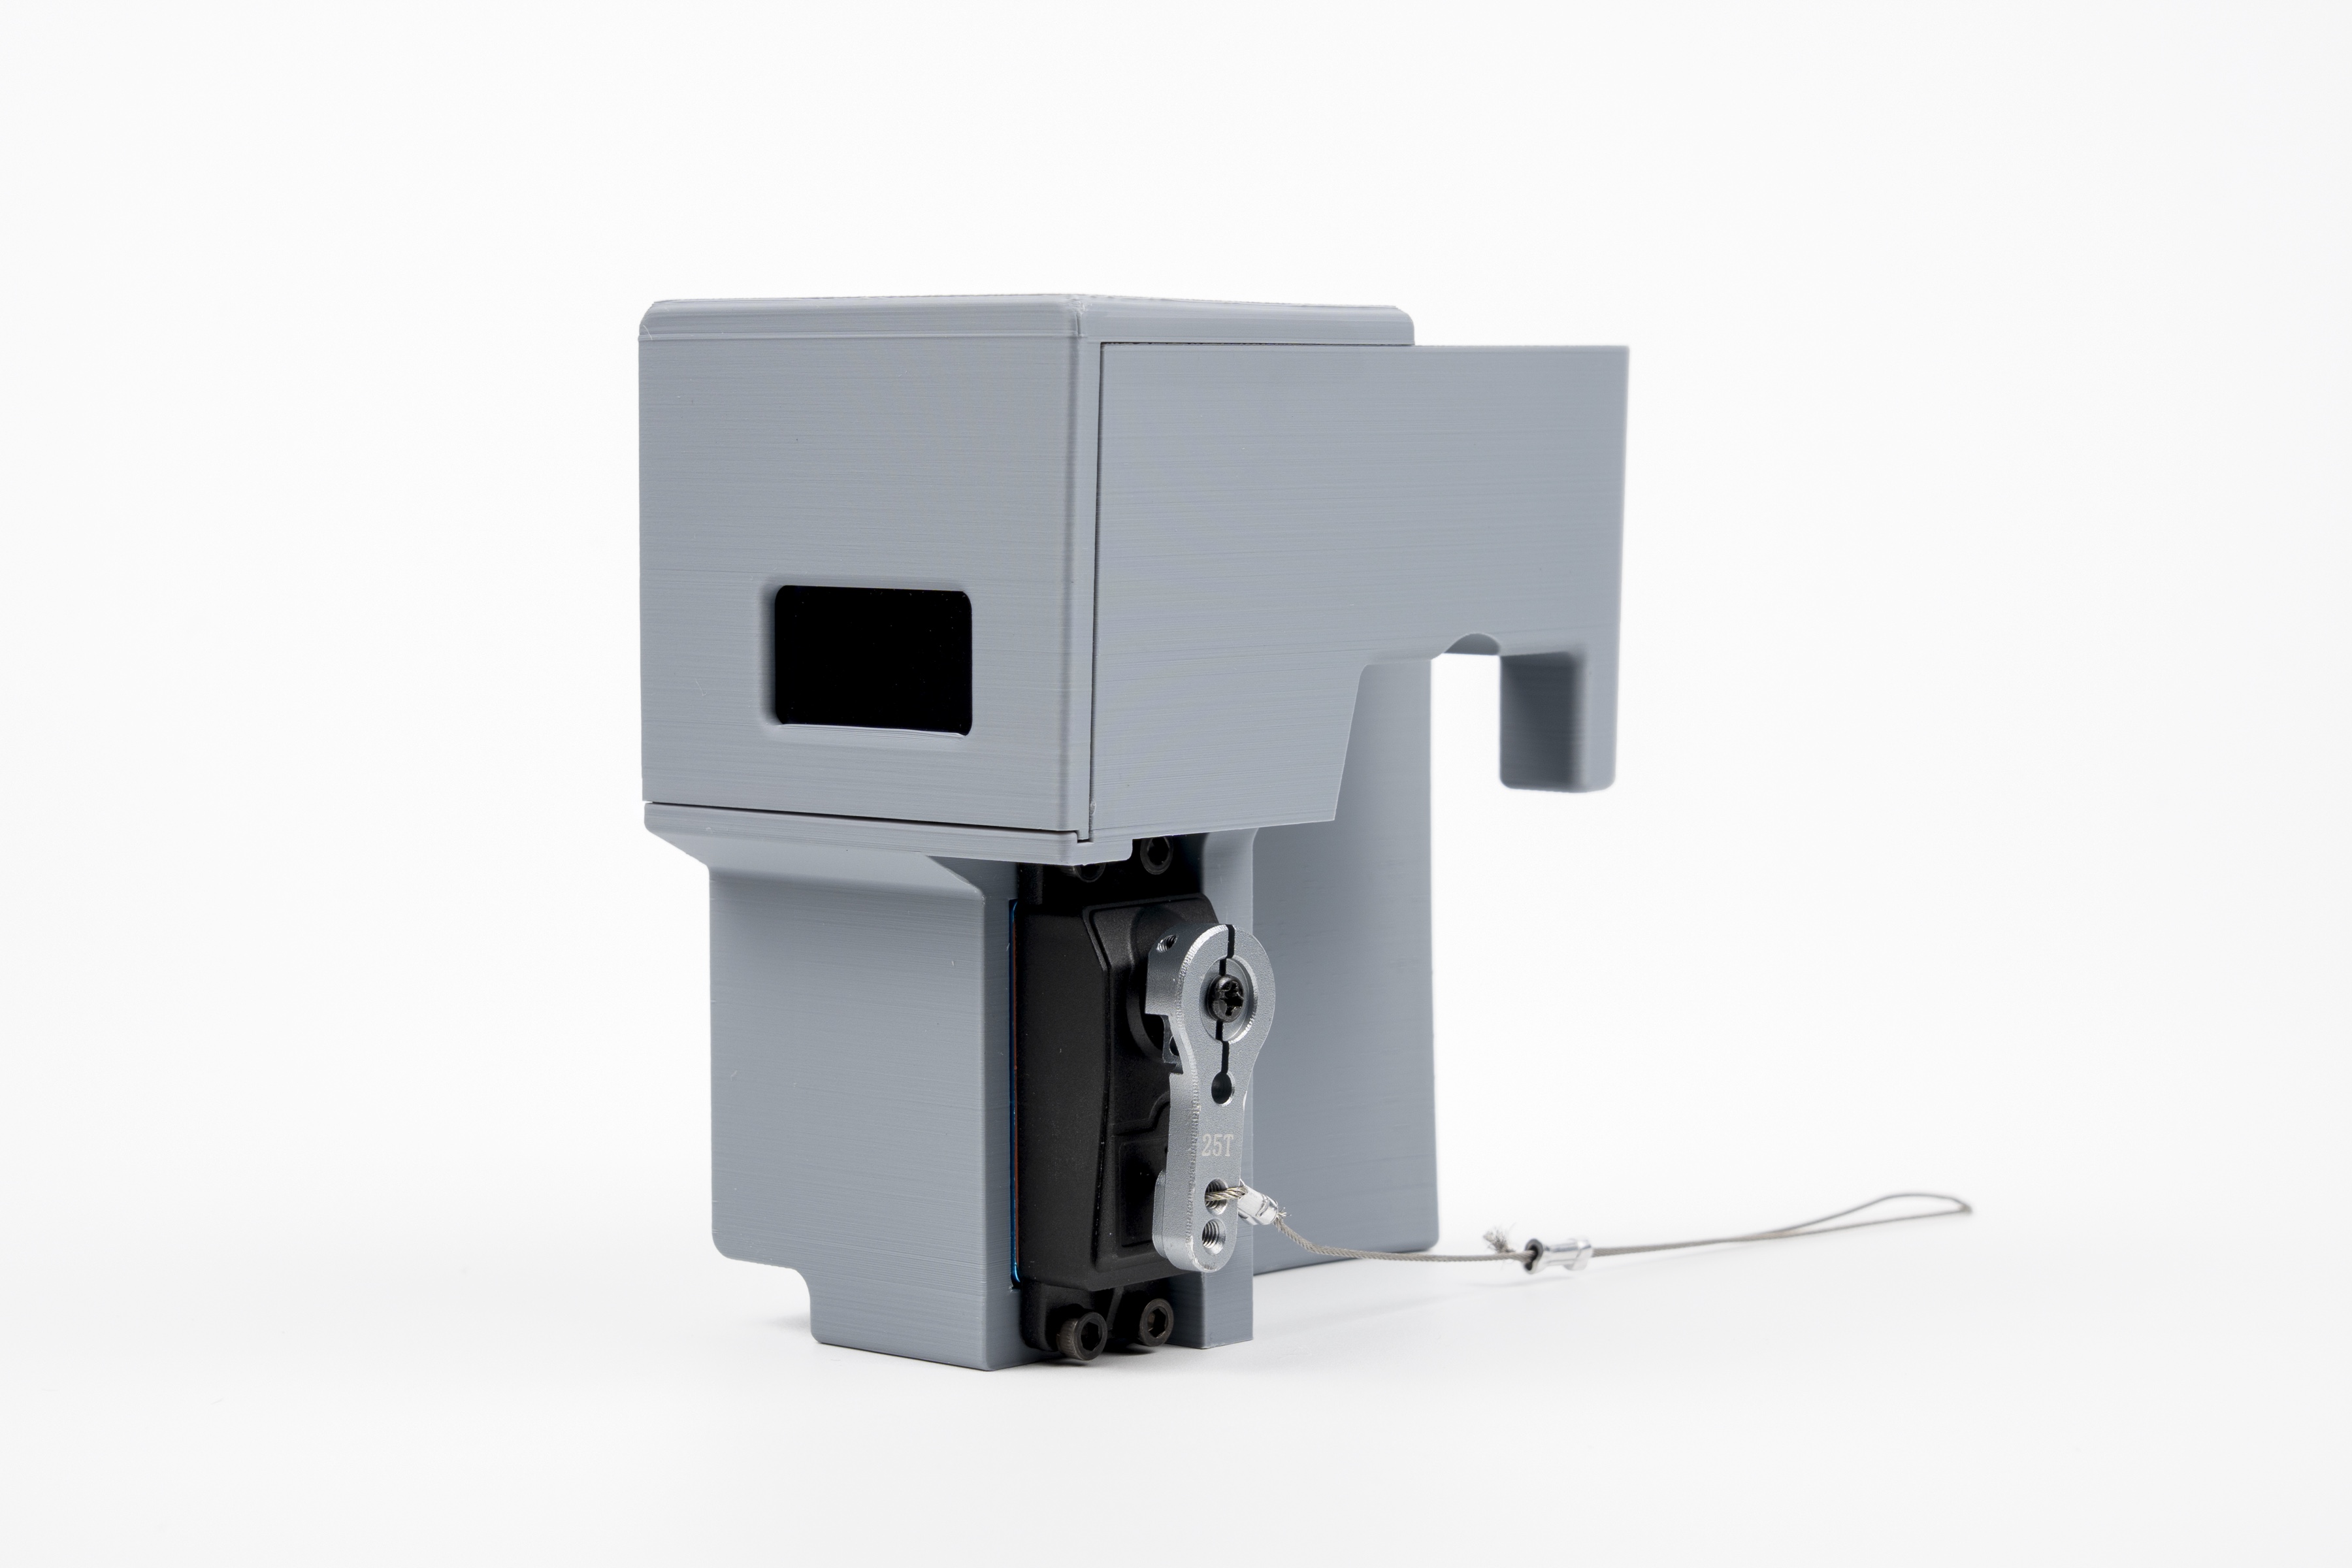
Device — assembled, side view
The assembled enclosure with servo and brake cable.
JPEG · 3600×2399 · 679 KB
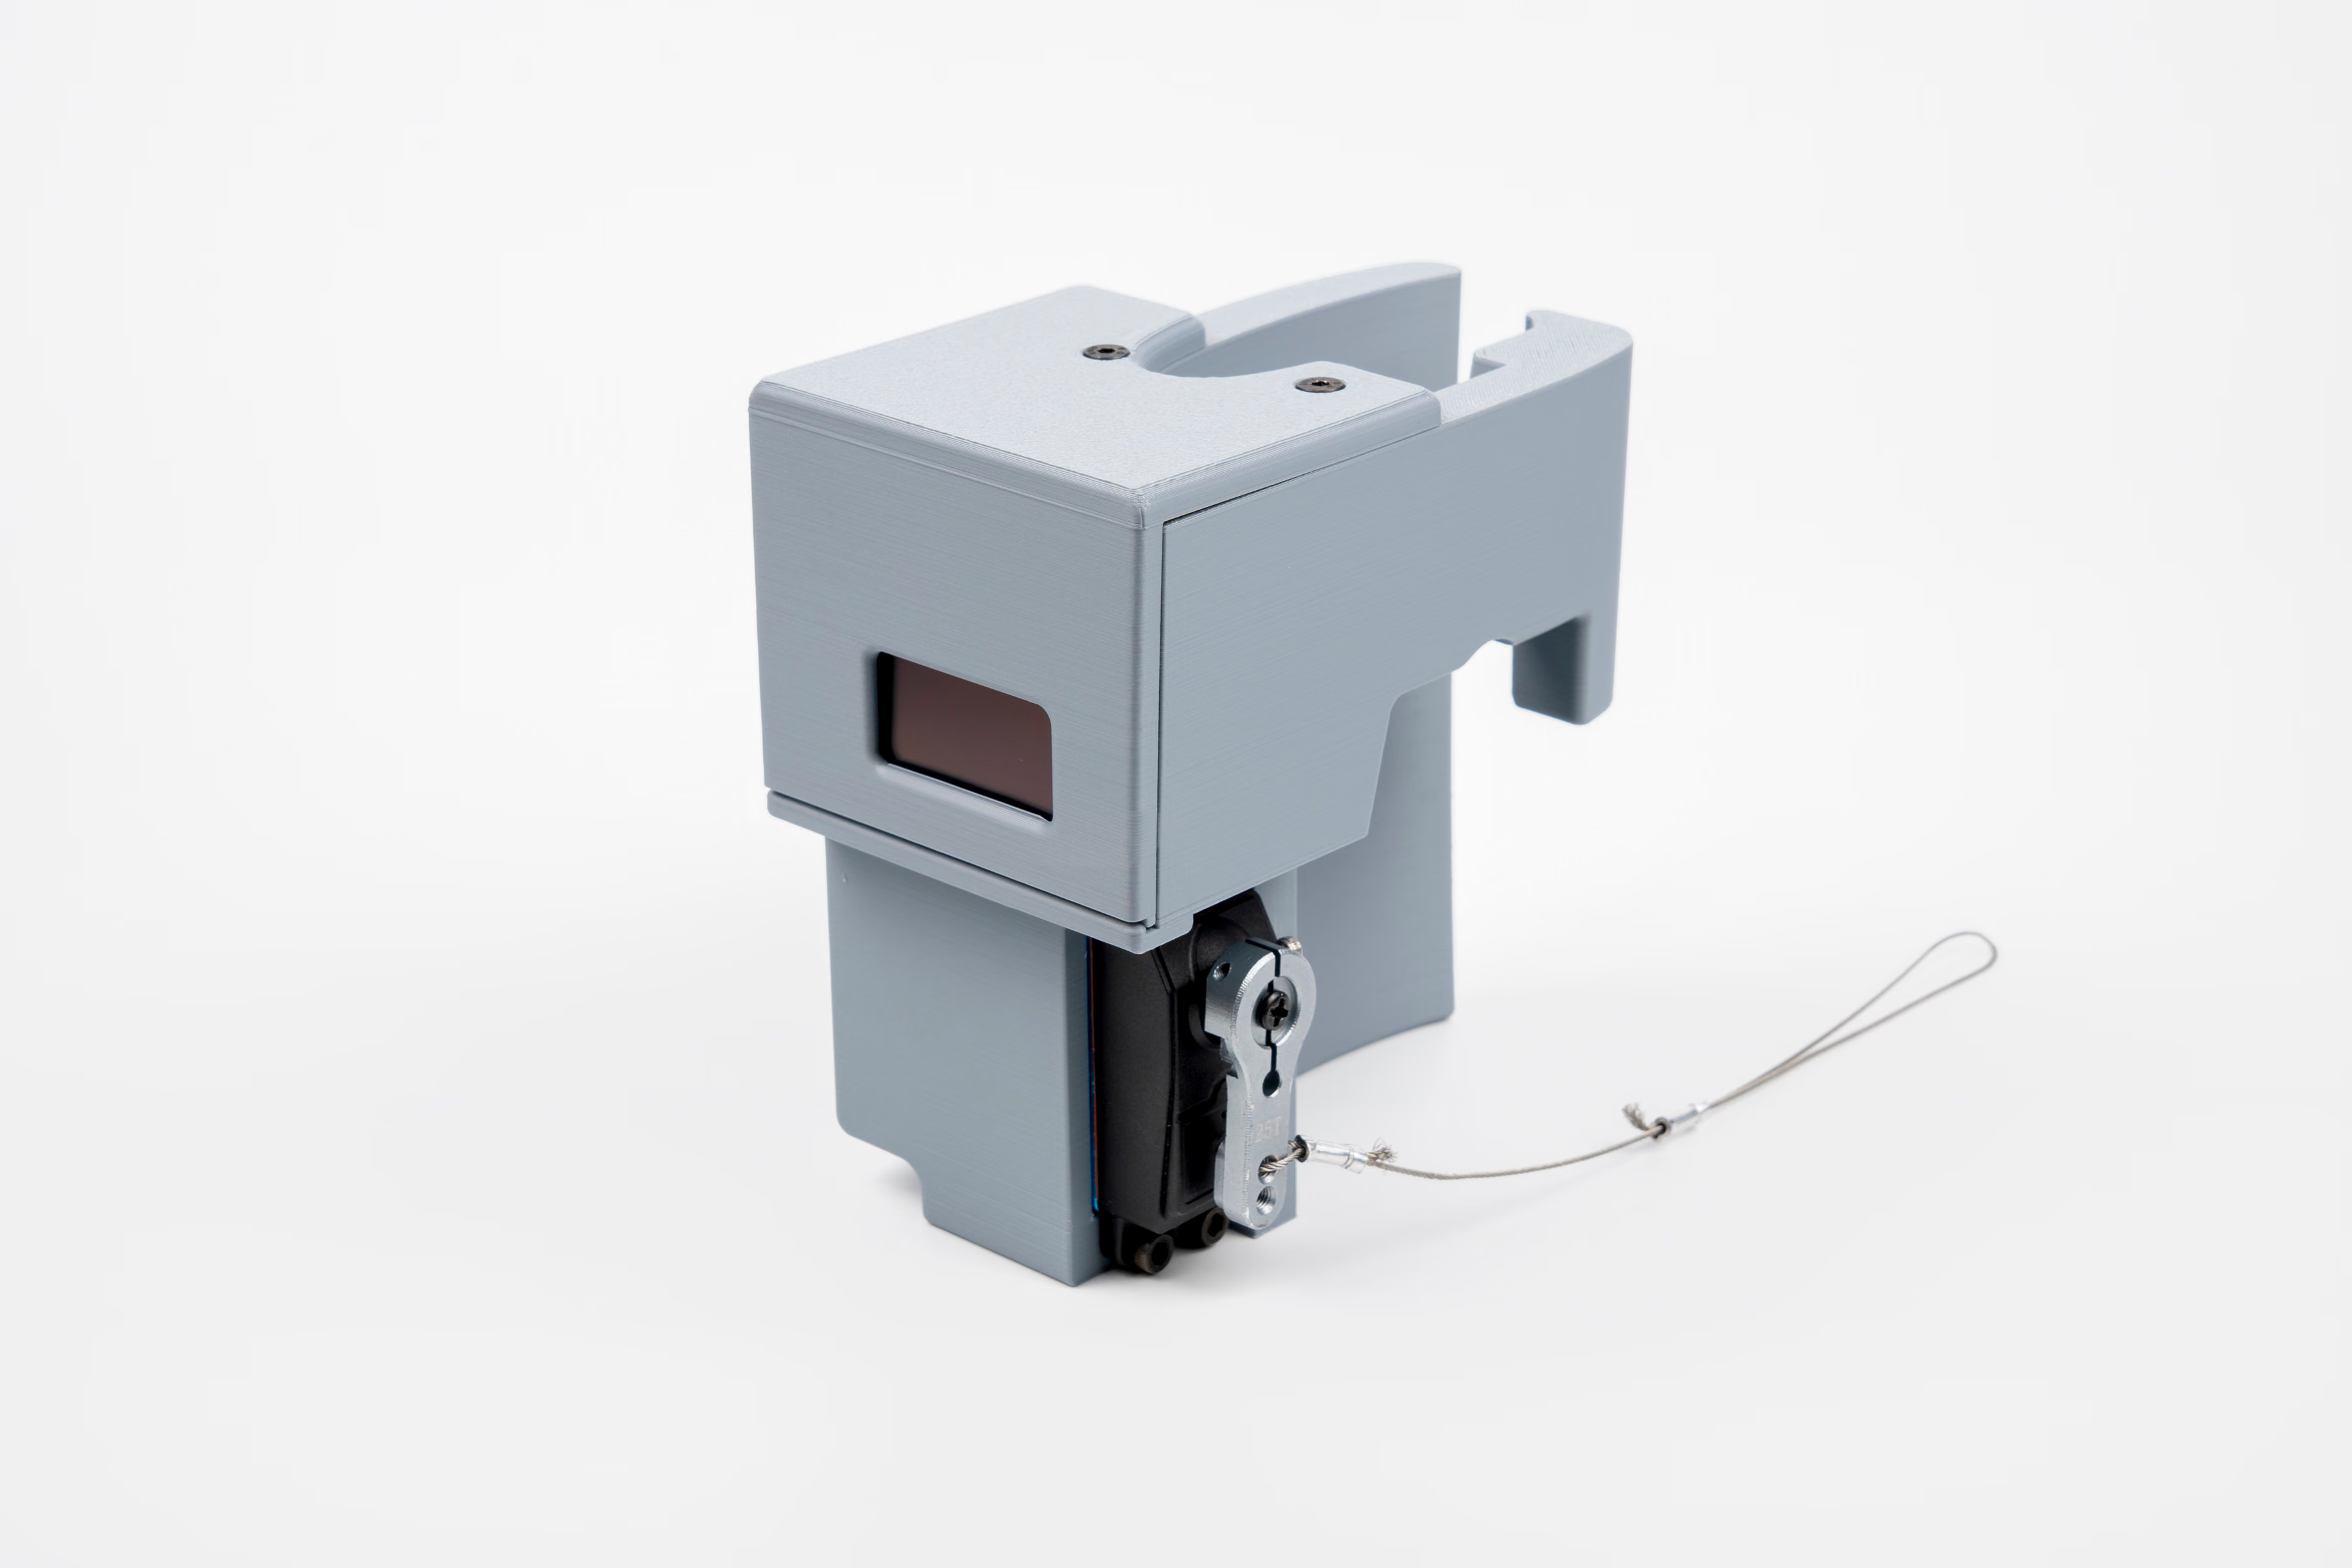
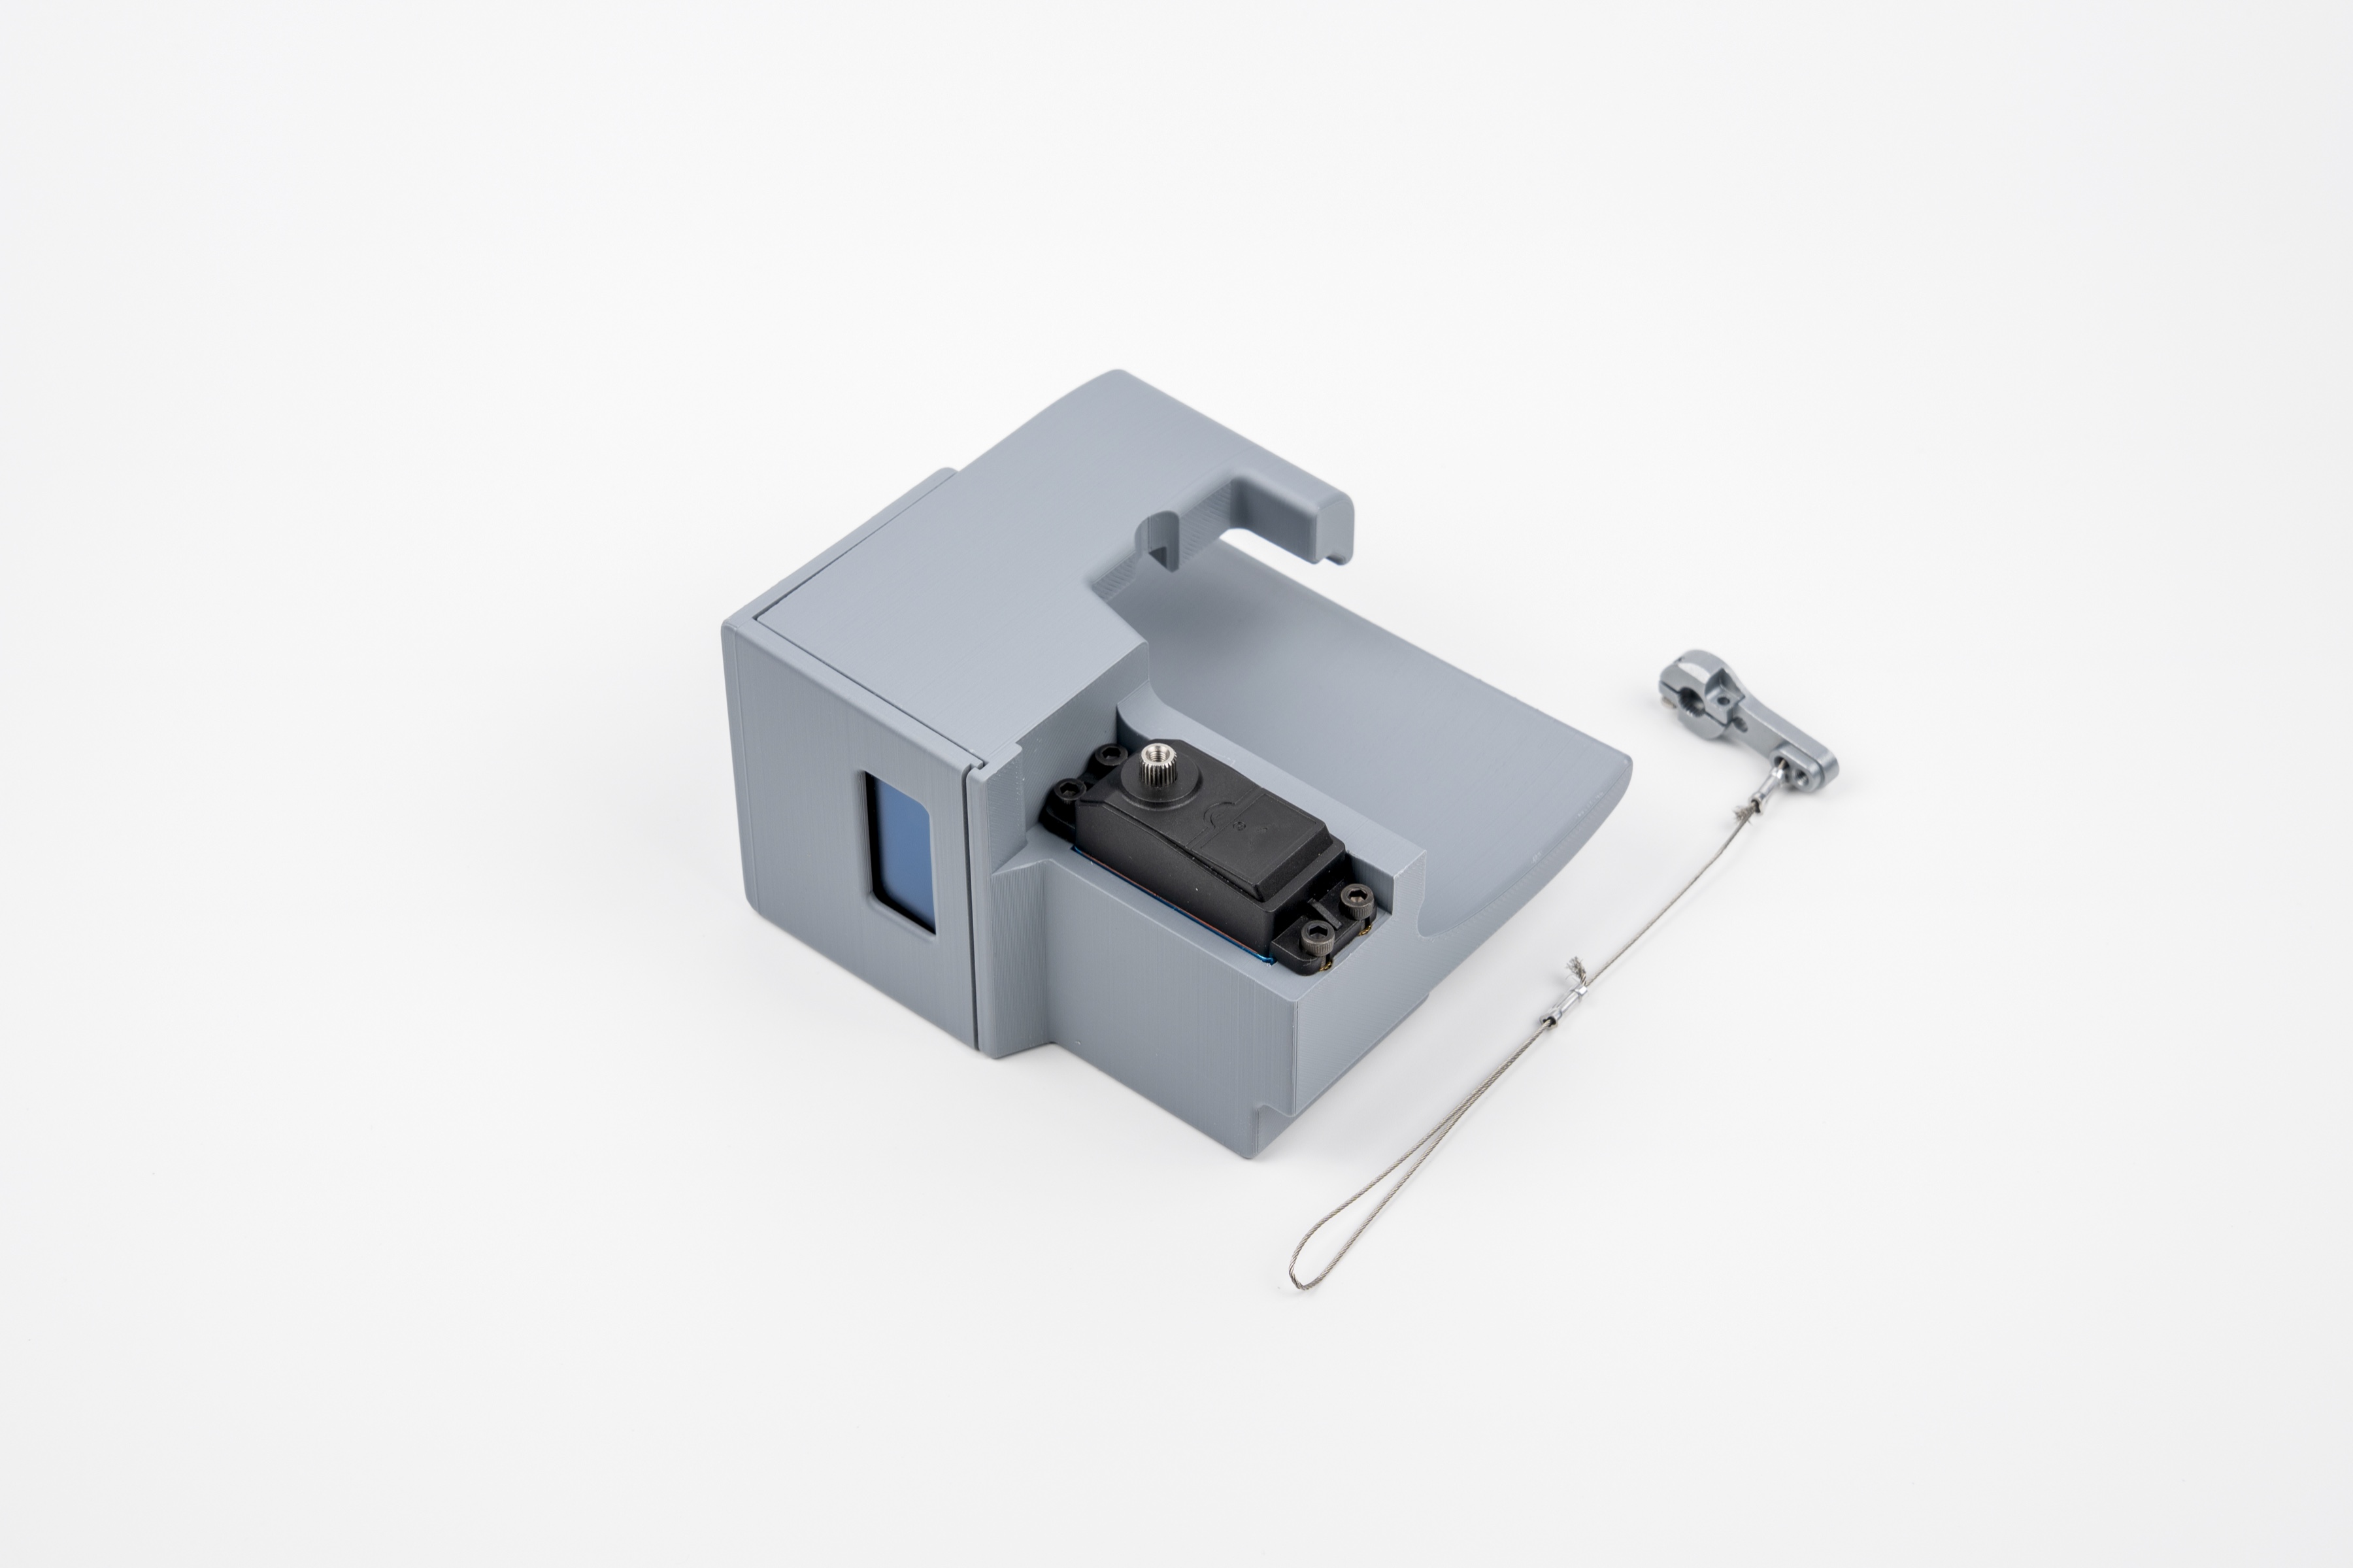
Device — assembled, top view
Rear channel and mounting arm that seat against the head tube.
JPEG · 3600×2400 · 867 KB
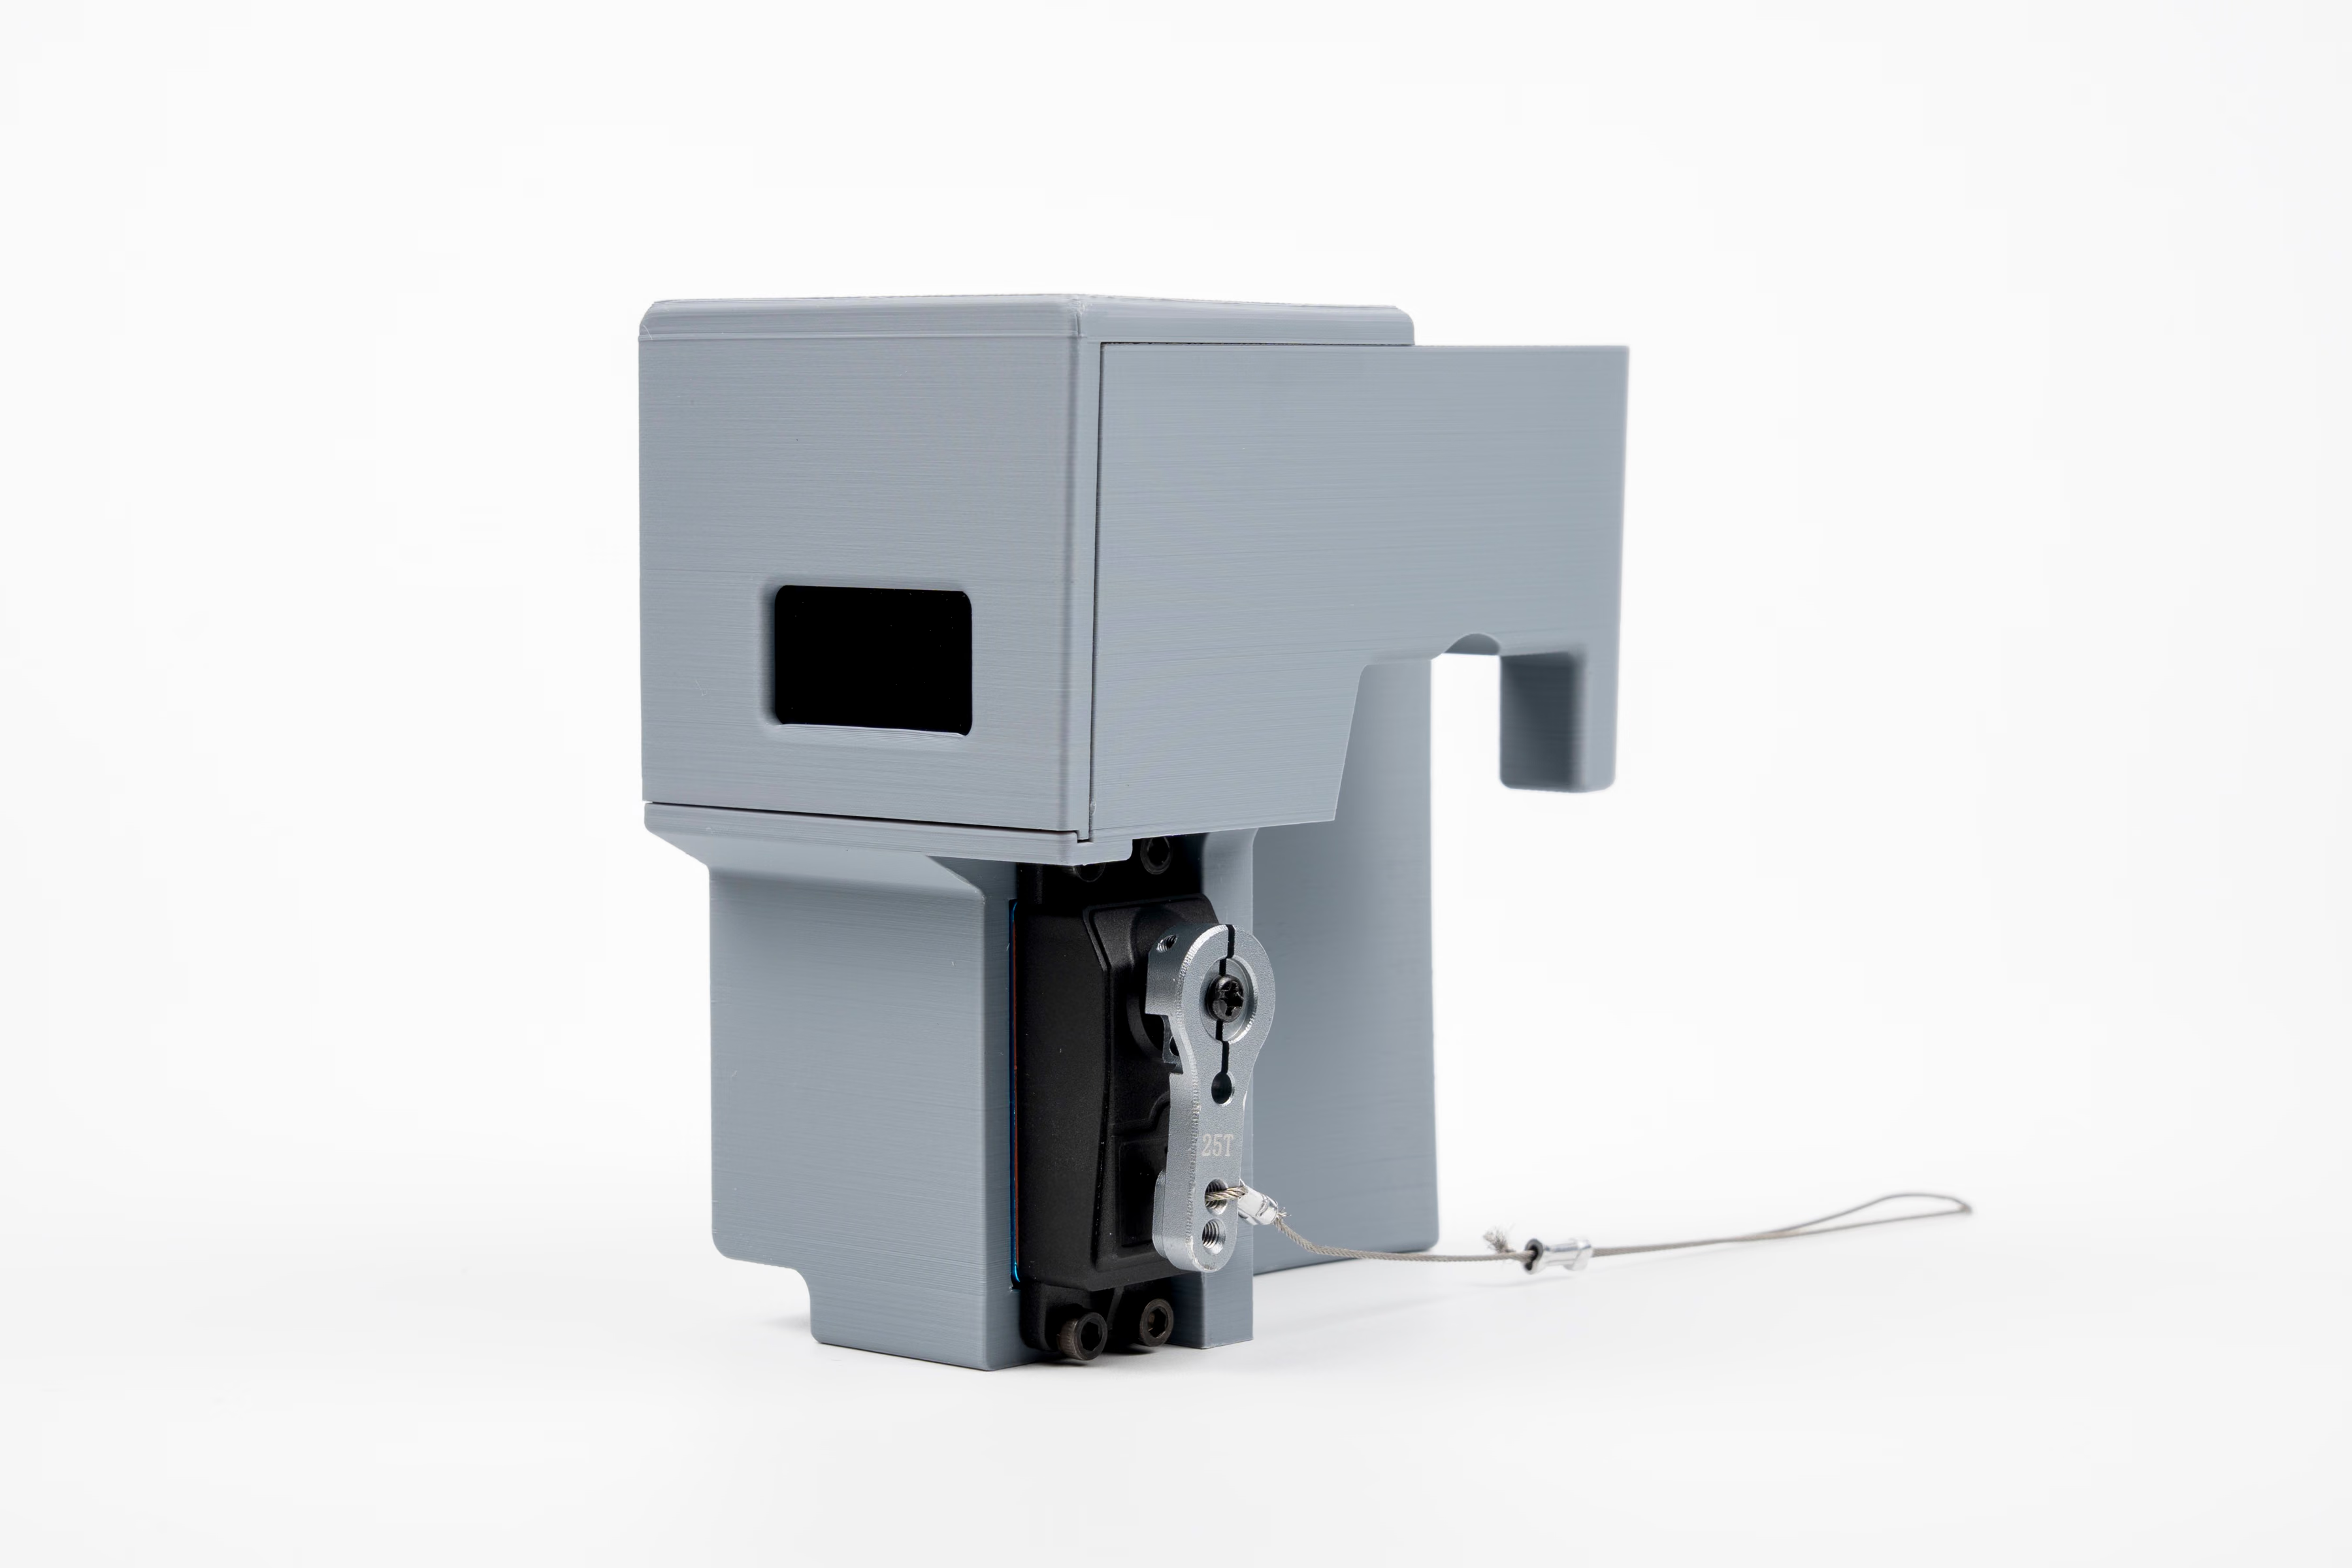
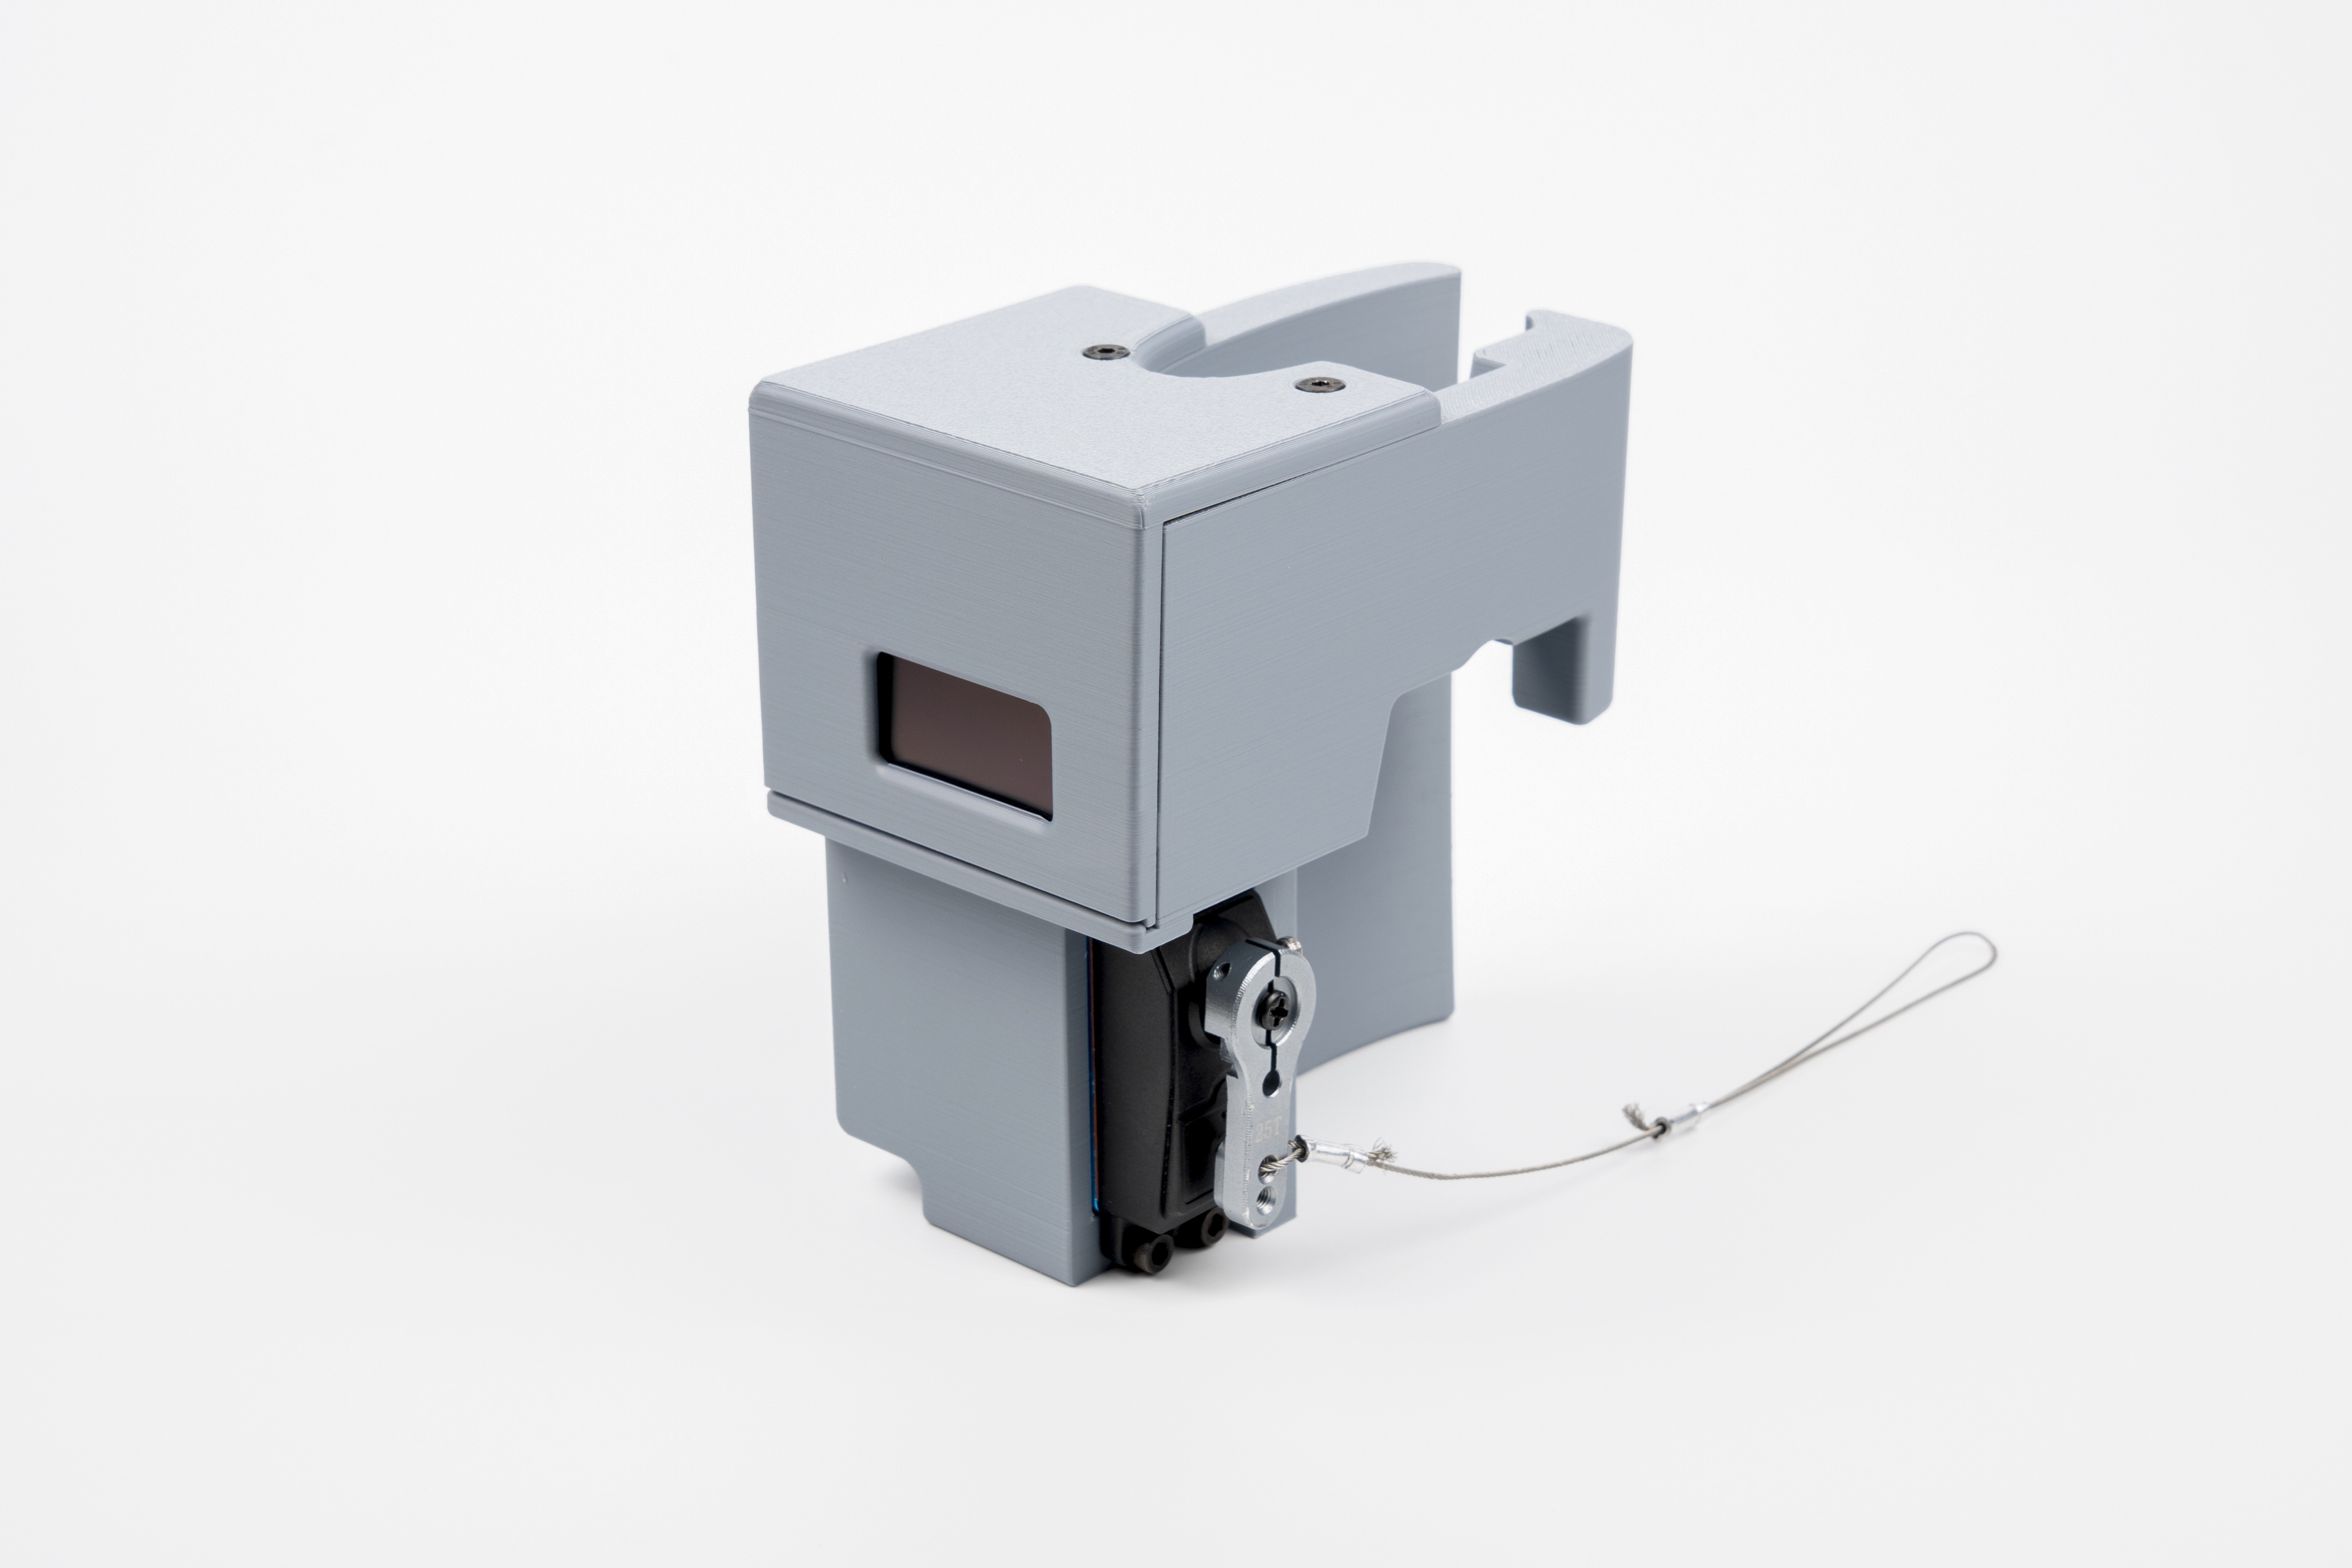
Device — assembled, front view
Rear channel and mounting arm that seat against the head tube.
JPEG · 3600×2400 · 943 KB
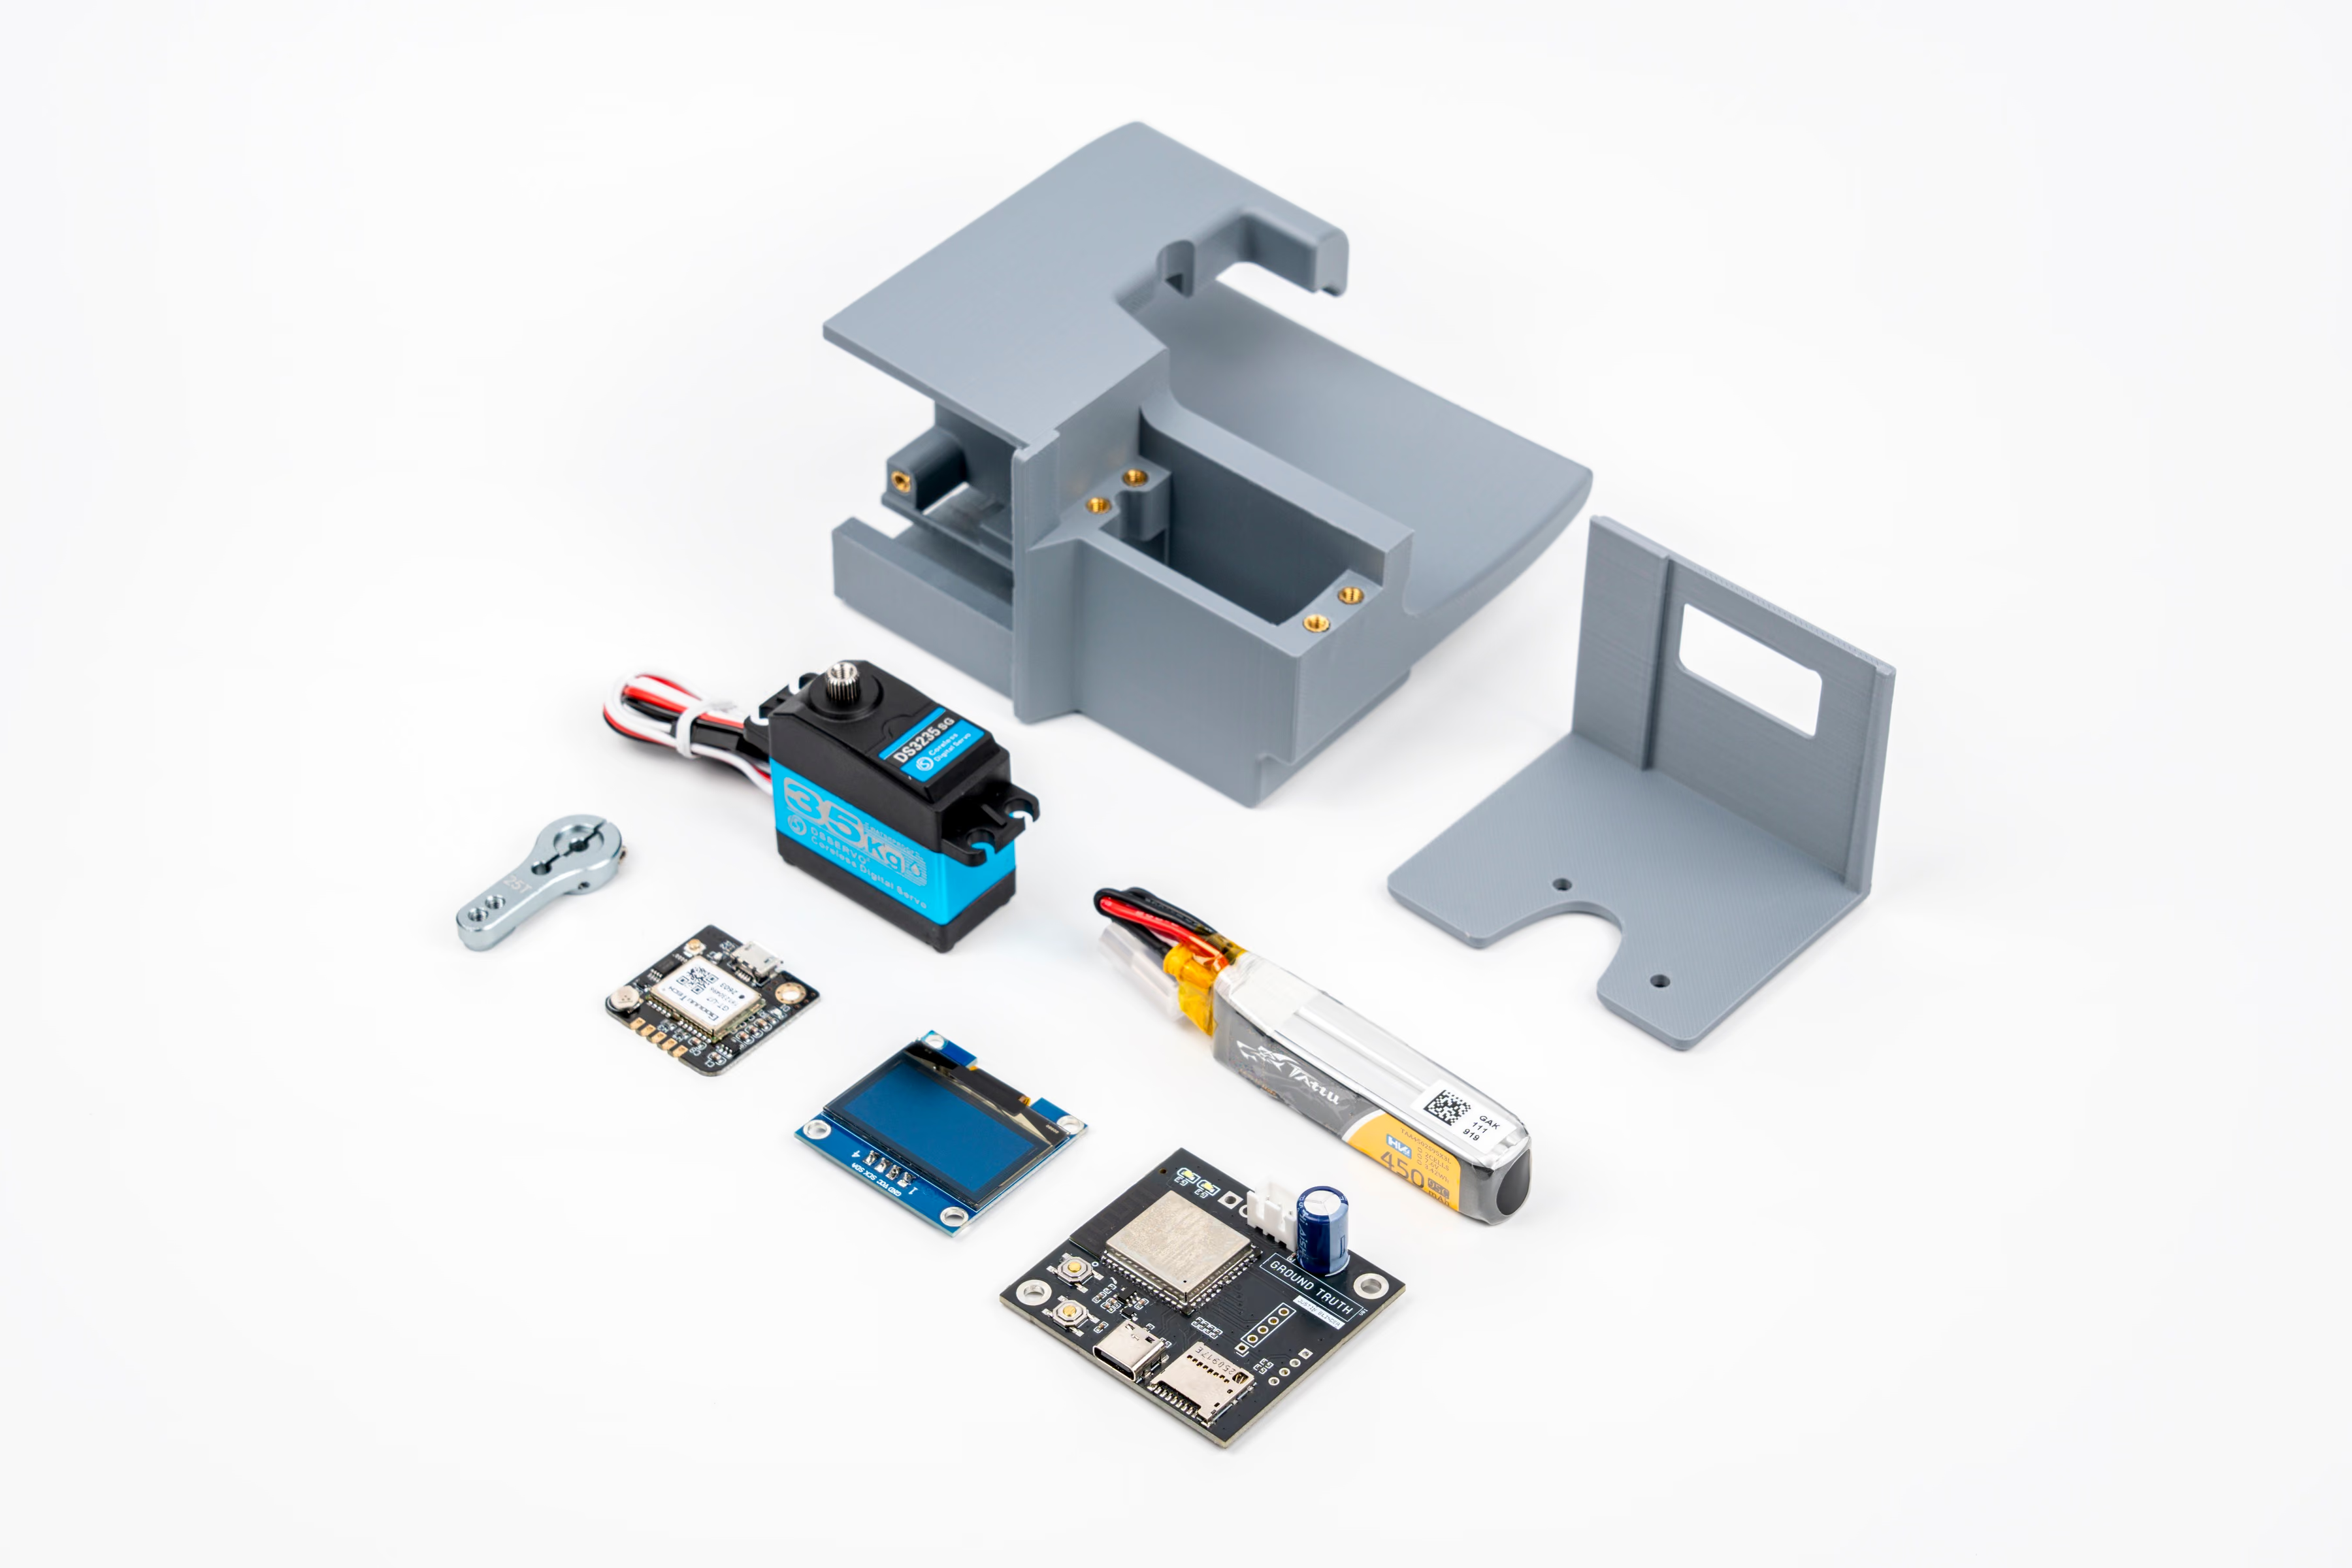
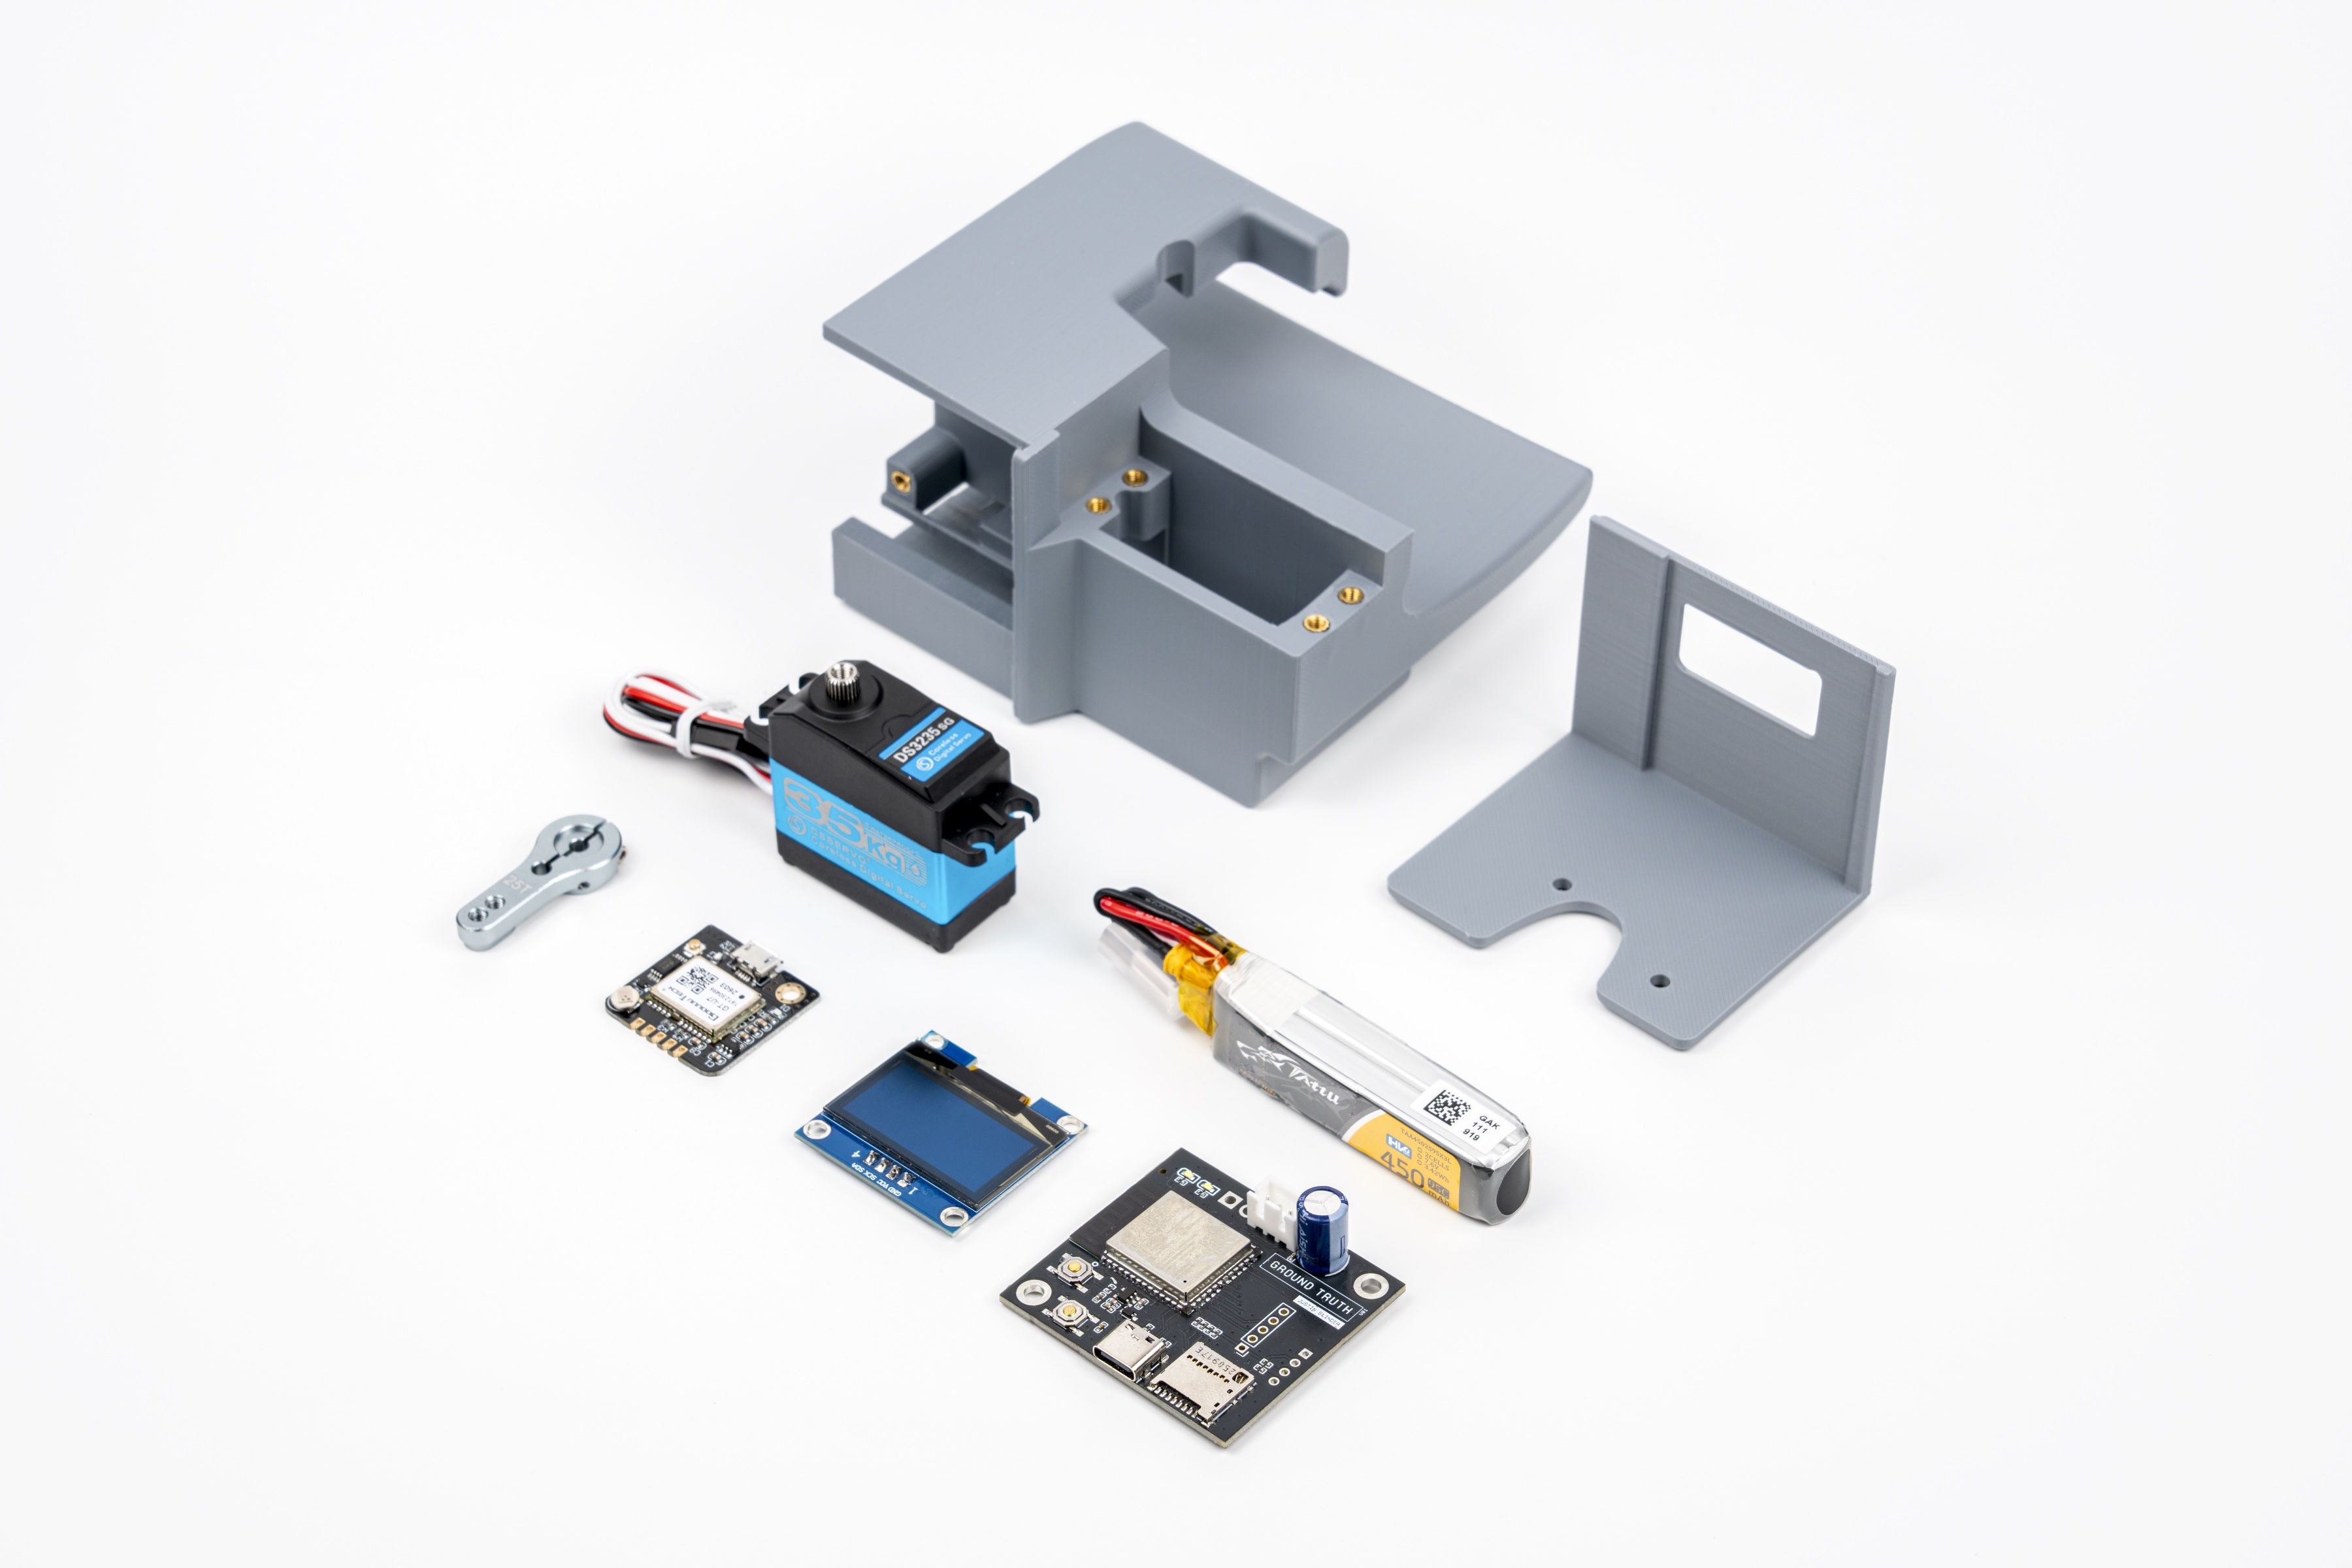
Device — components
Enclosure body, mounting bracket, high-torque servo, servo horn, GPS module, OLED display, battery and custom mainboard.
JPEG · 3600×2400 · 786 KB
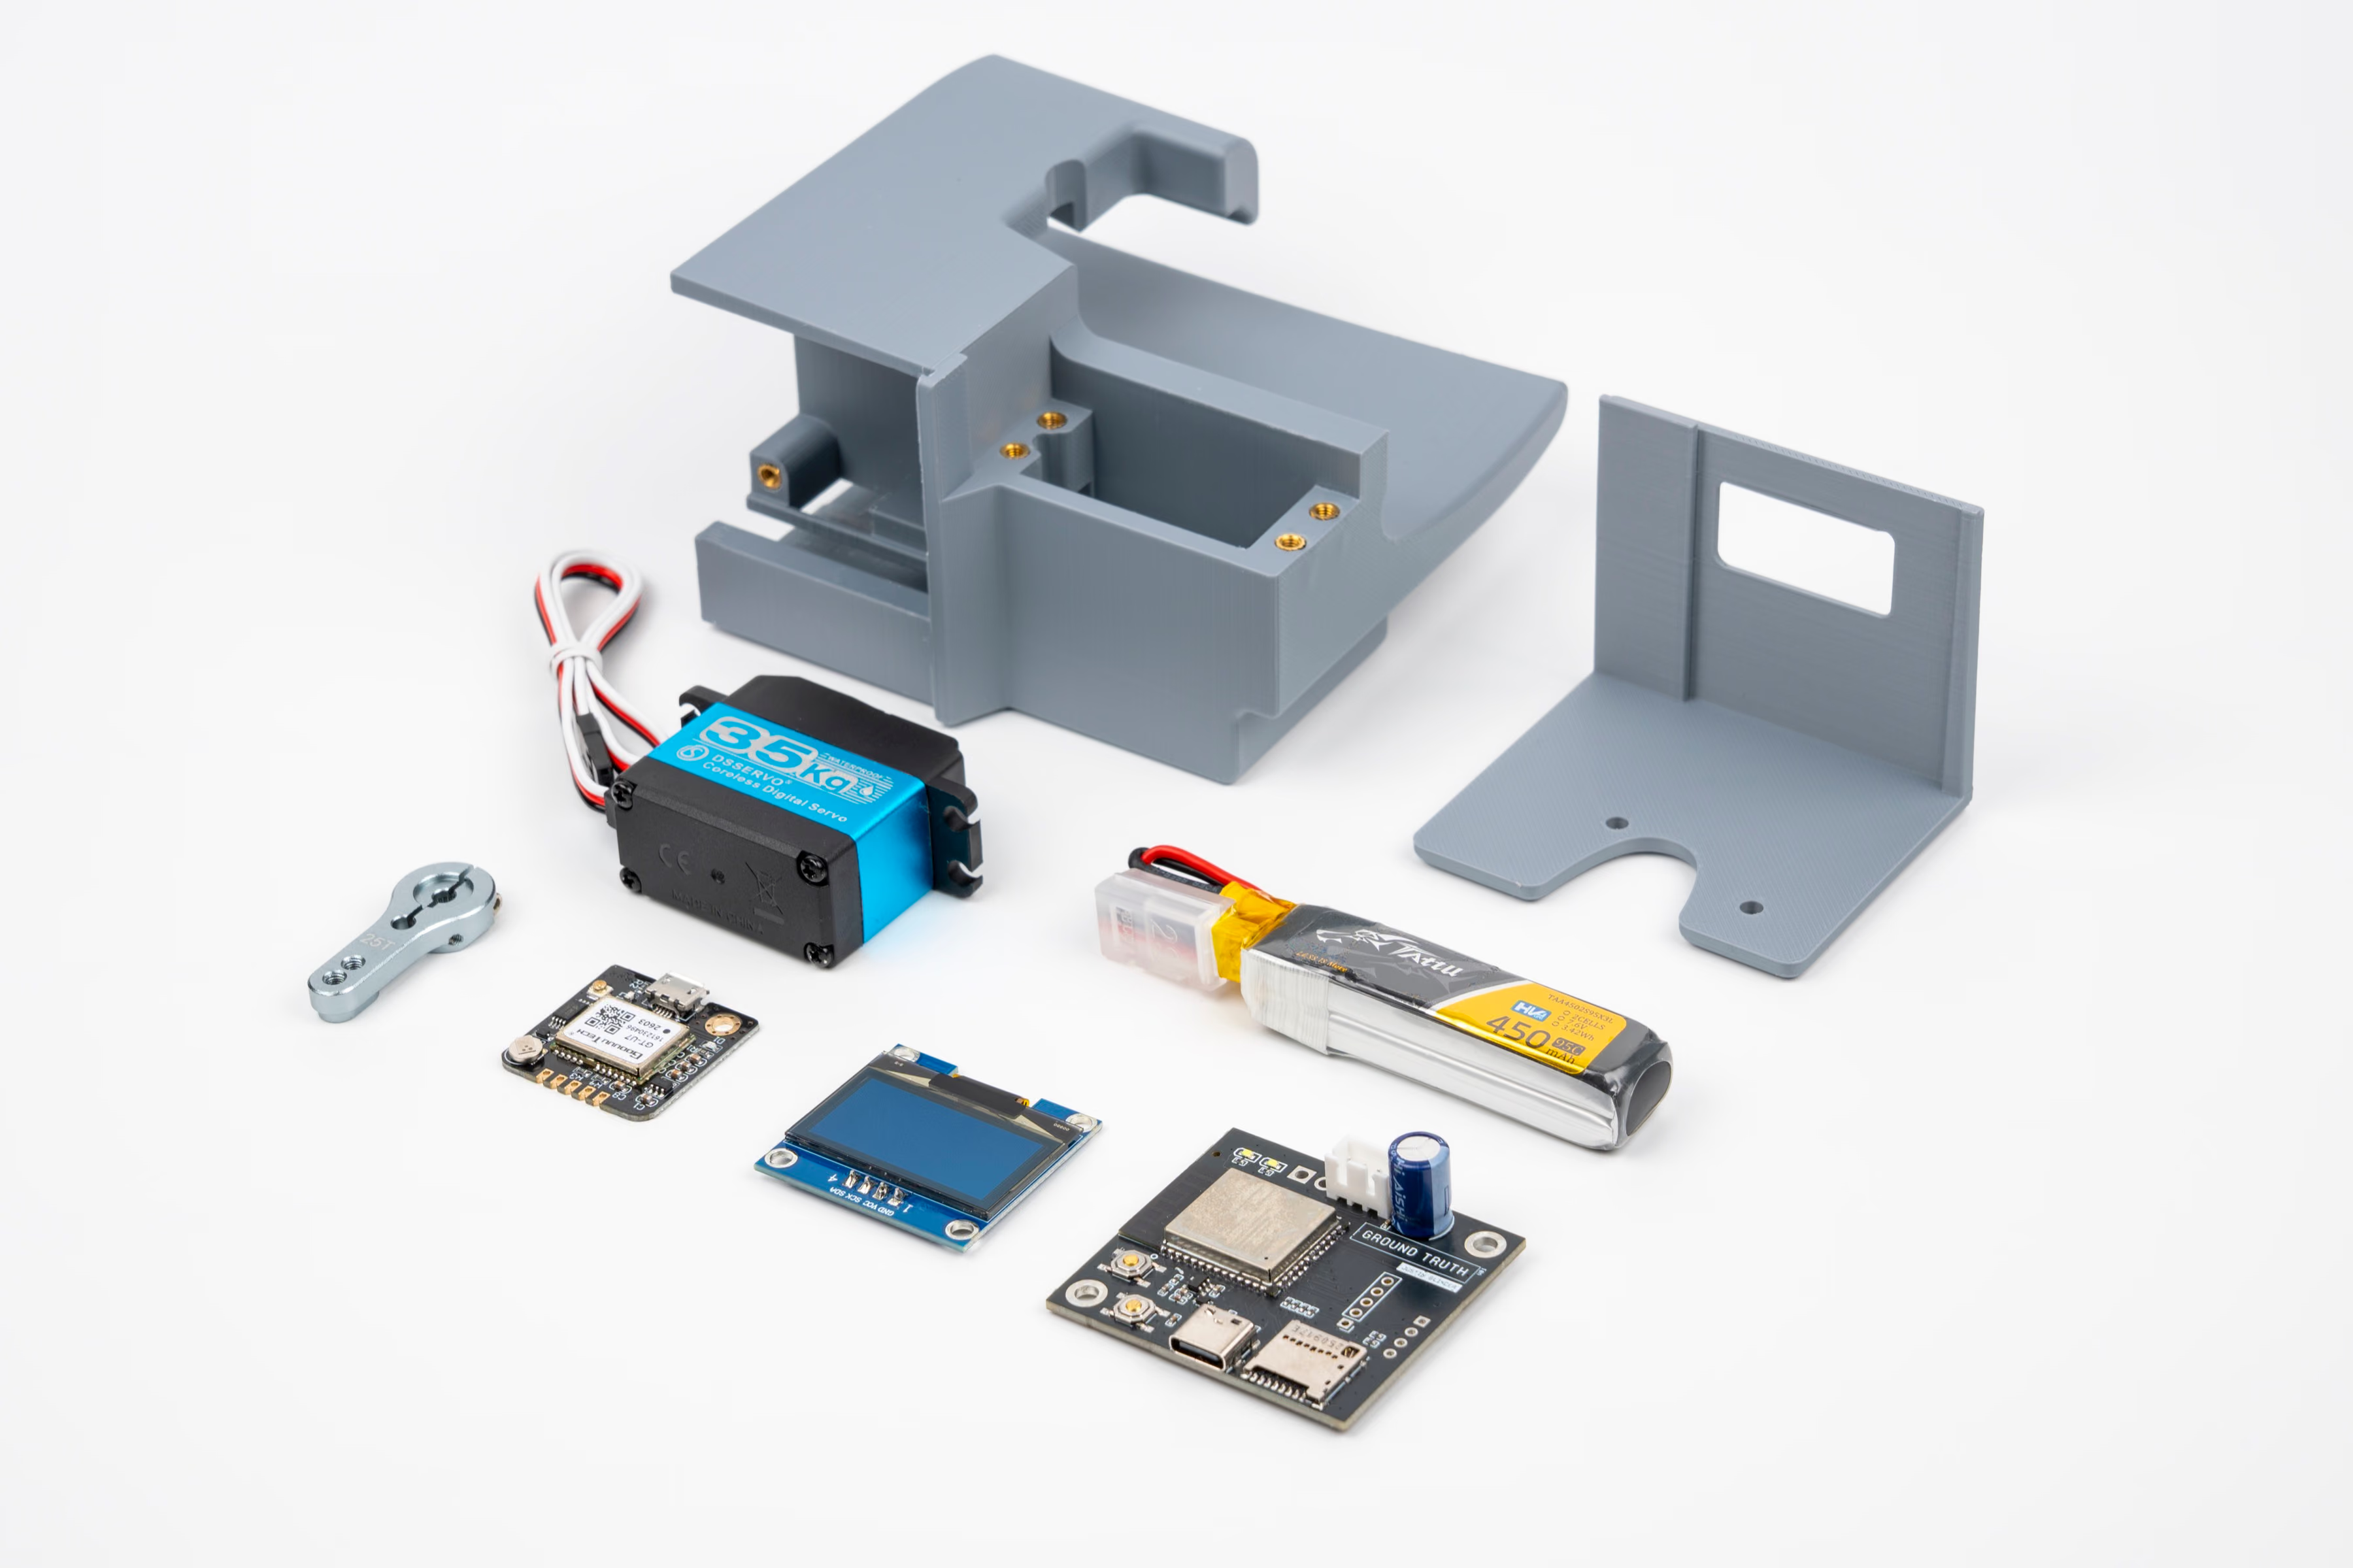
Device — components, alternate view
A second angle on the same disassembled components.
JPEG · 3600×2399 · 891 KB
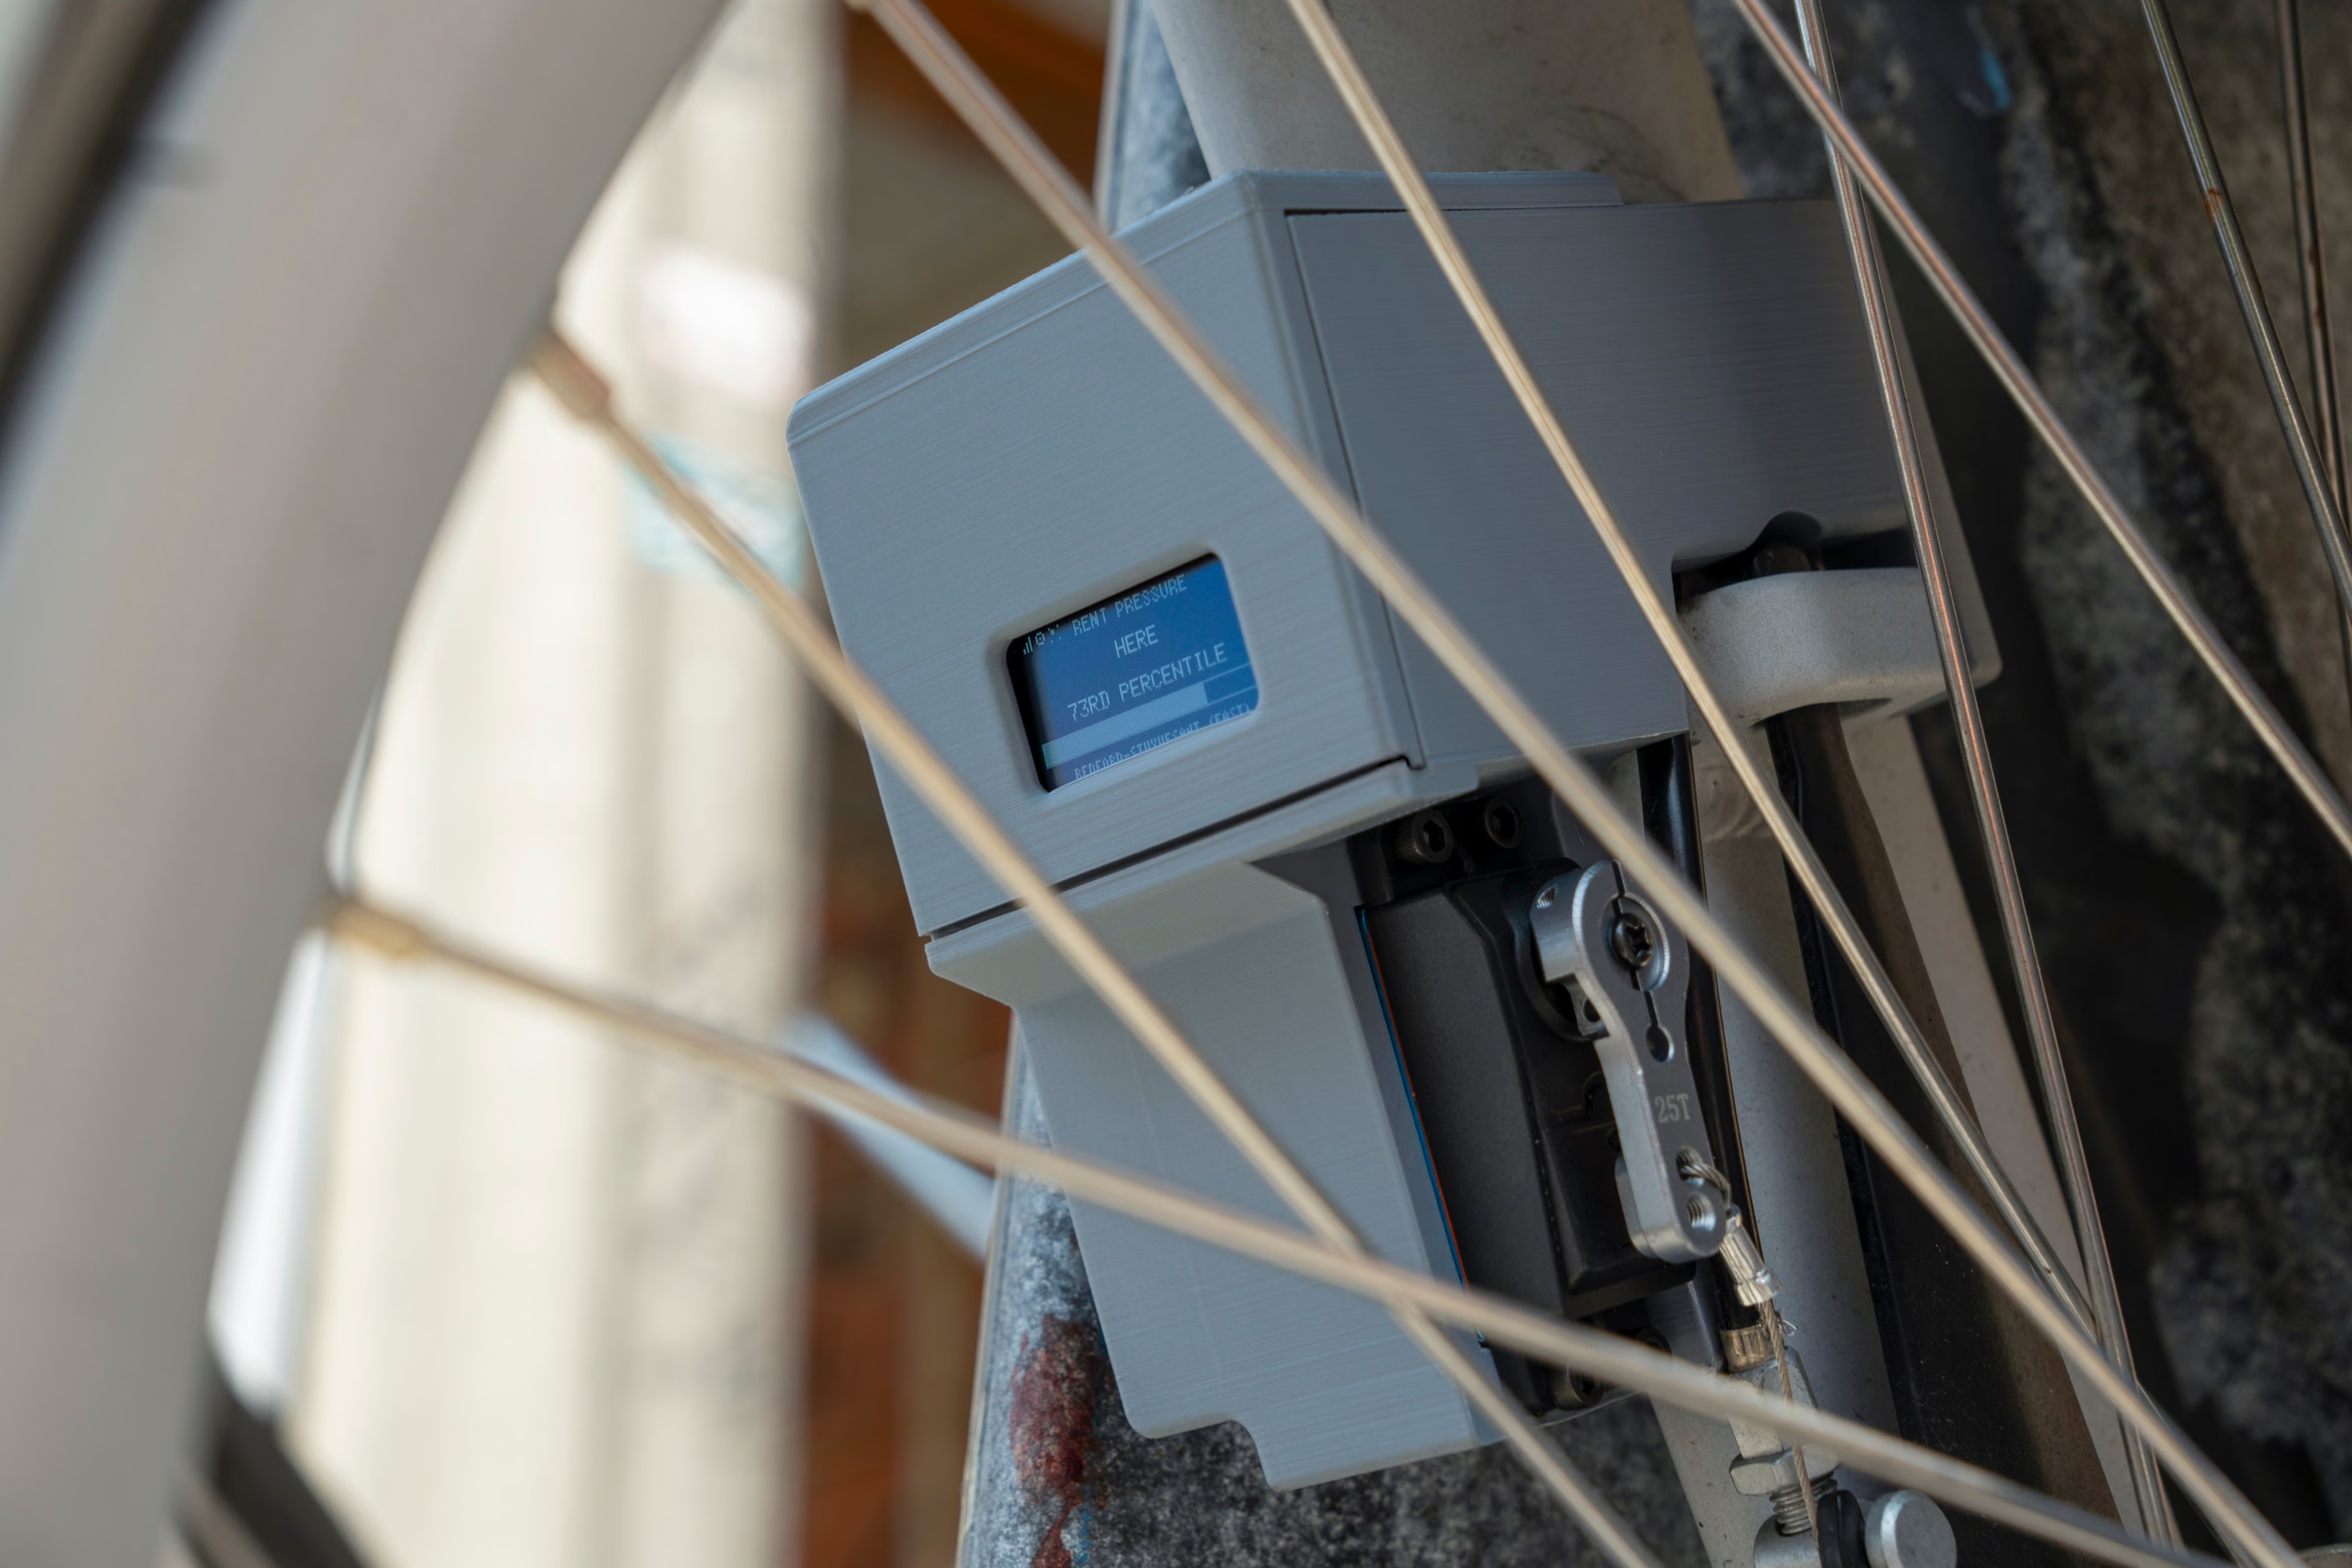
Mounted device - data display
Mounted device, reading and displaying local rent burden data
JPEG · 3600×2400 · 1.5 MB
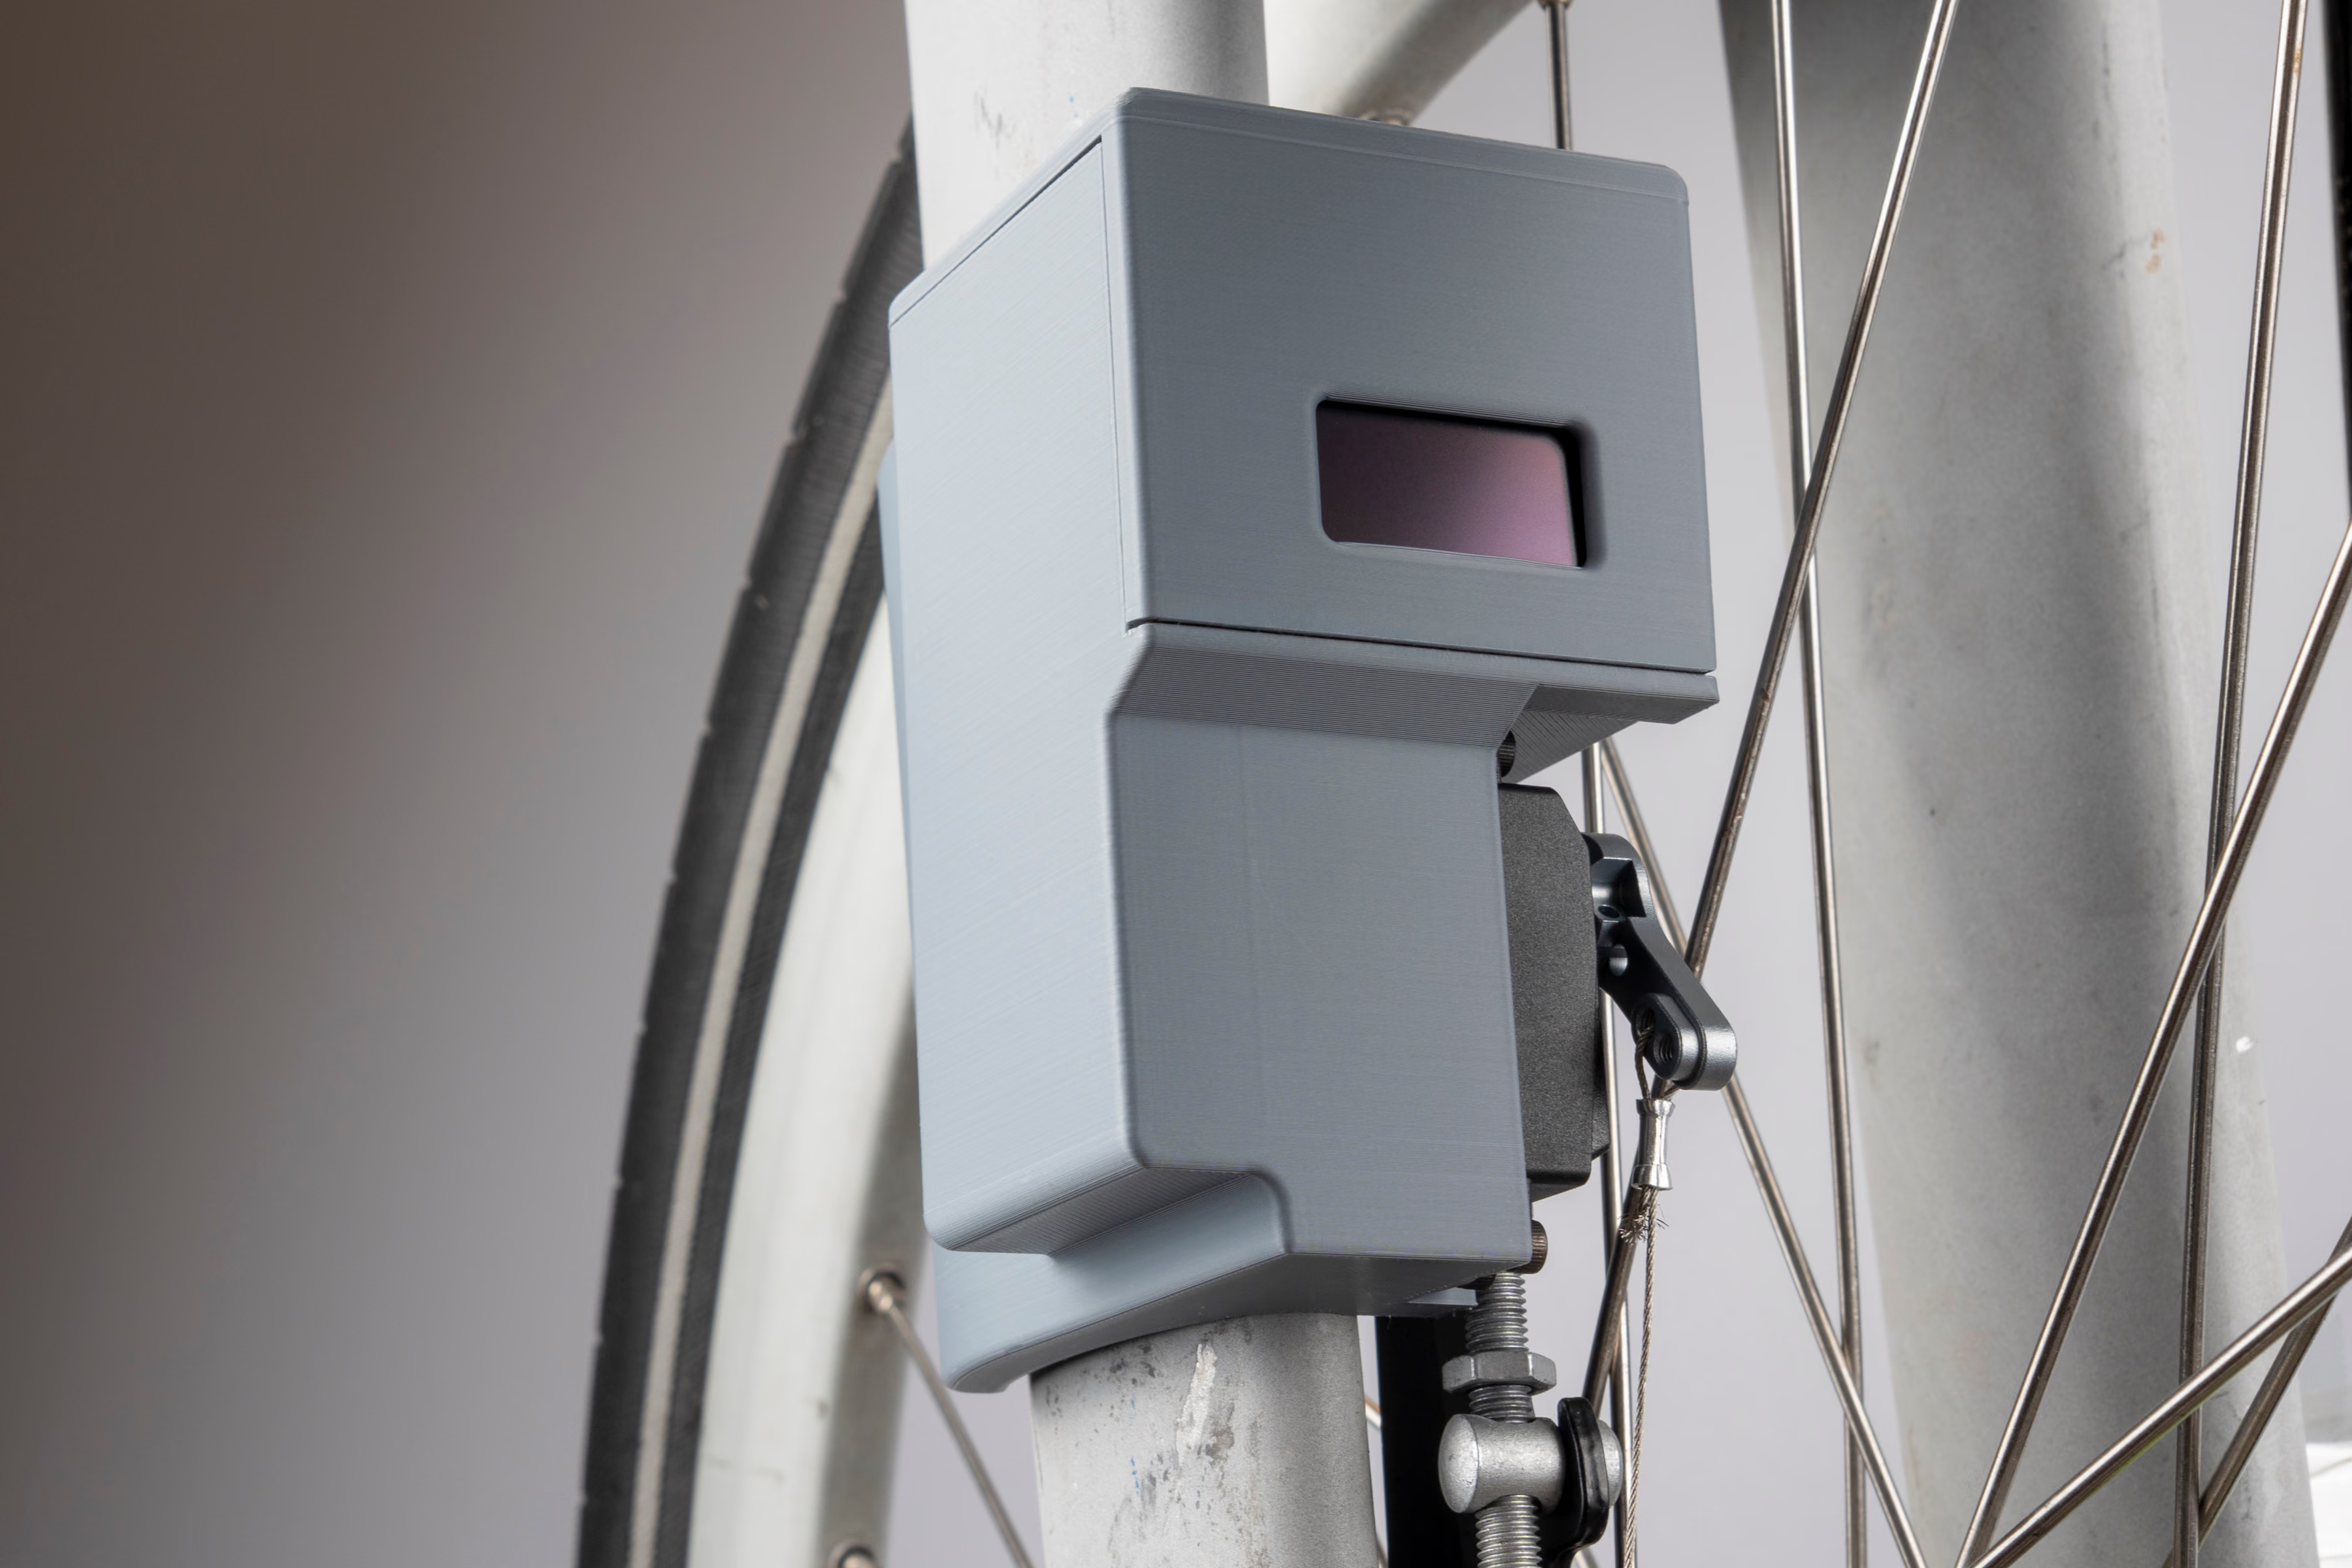
Mounted device - servo engaged
Mounted on the left fork tube, servo arm pulling up on brake.
JPEG · 3600×2400 · 1.7 MB
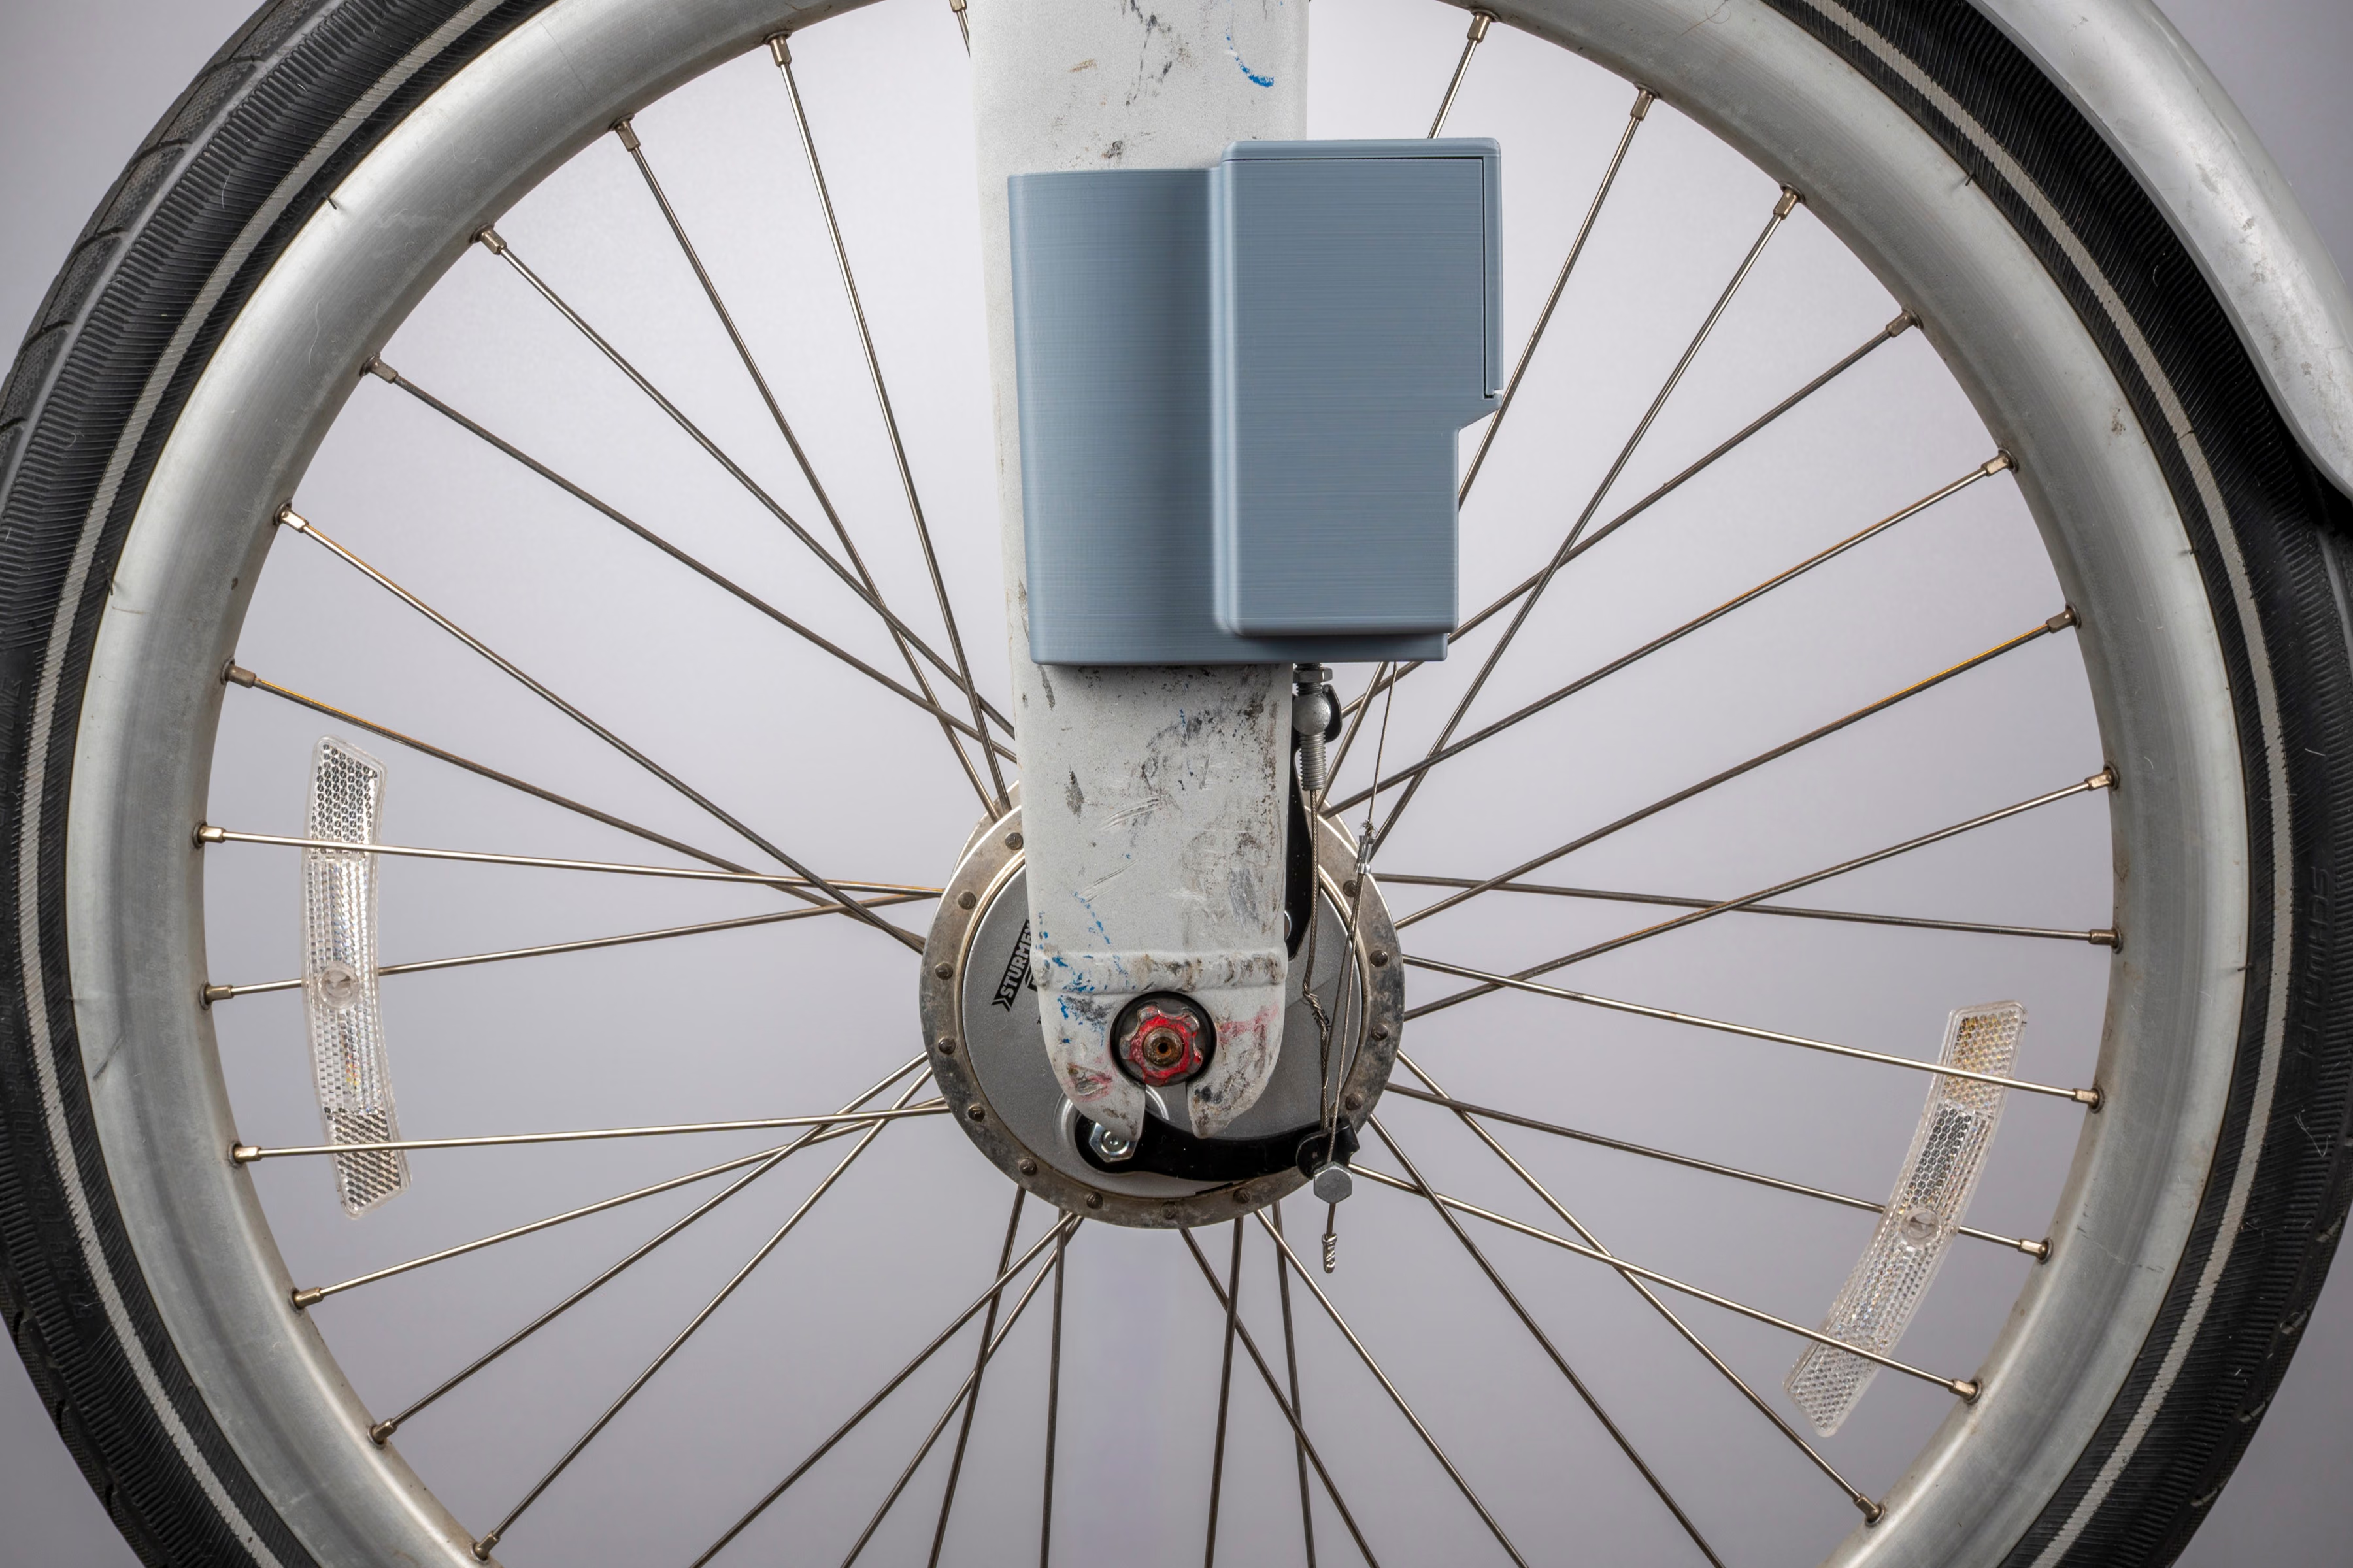
Mounted device — side view
Close up of device attached to left fork tube
JPEG · 3600×2399 · 2.0 MB

Mounted device - close up
Close up cable connecinting device to drum brake hub arm
JPEG · 3600×2400 · 2.0 MB
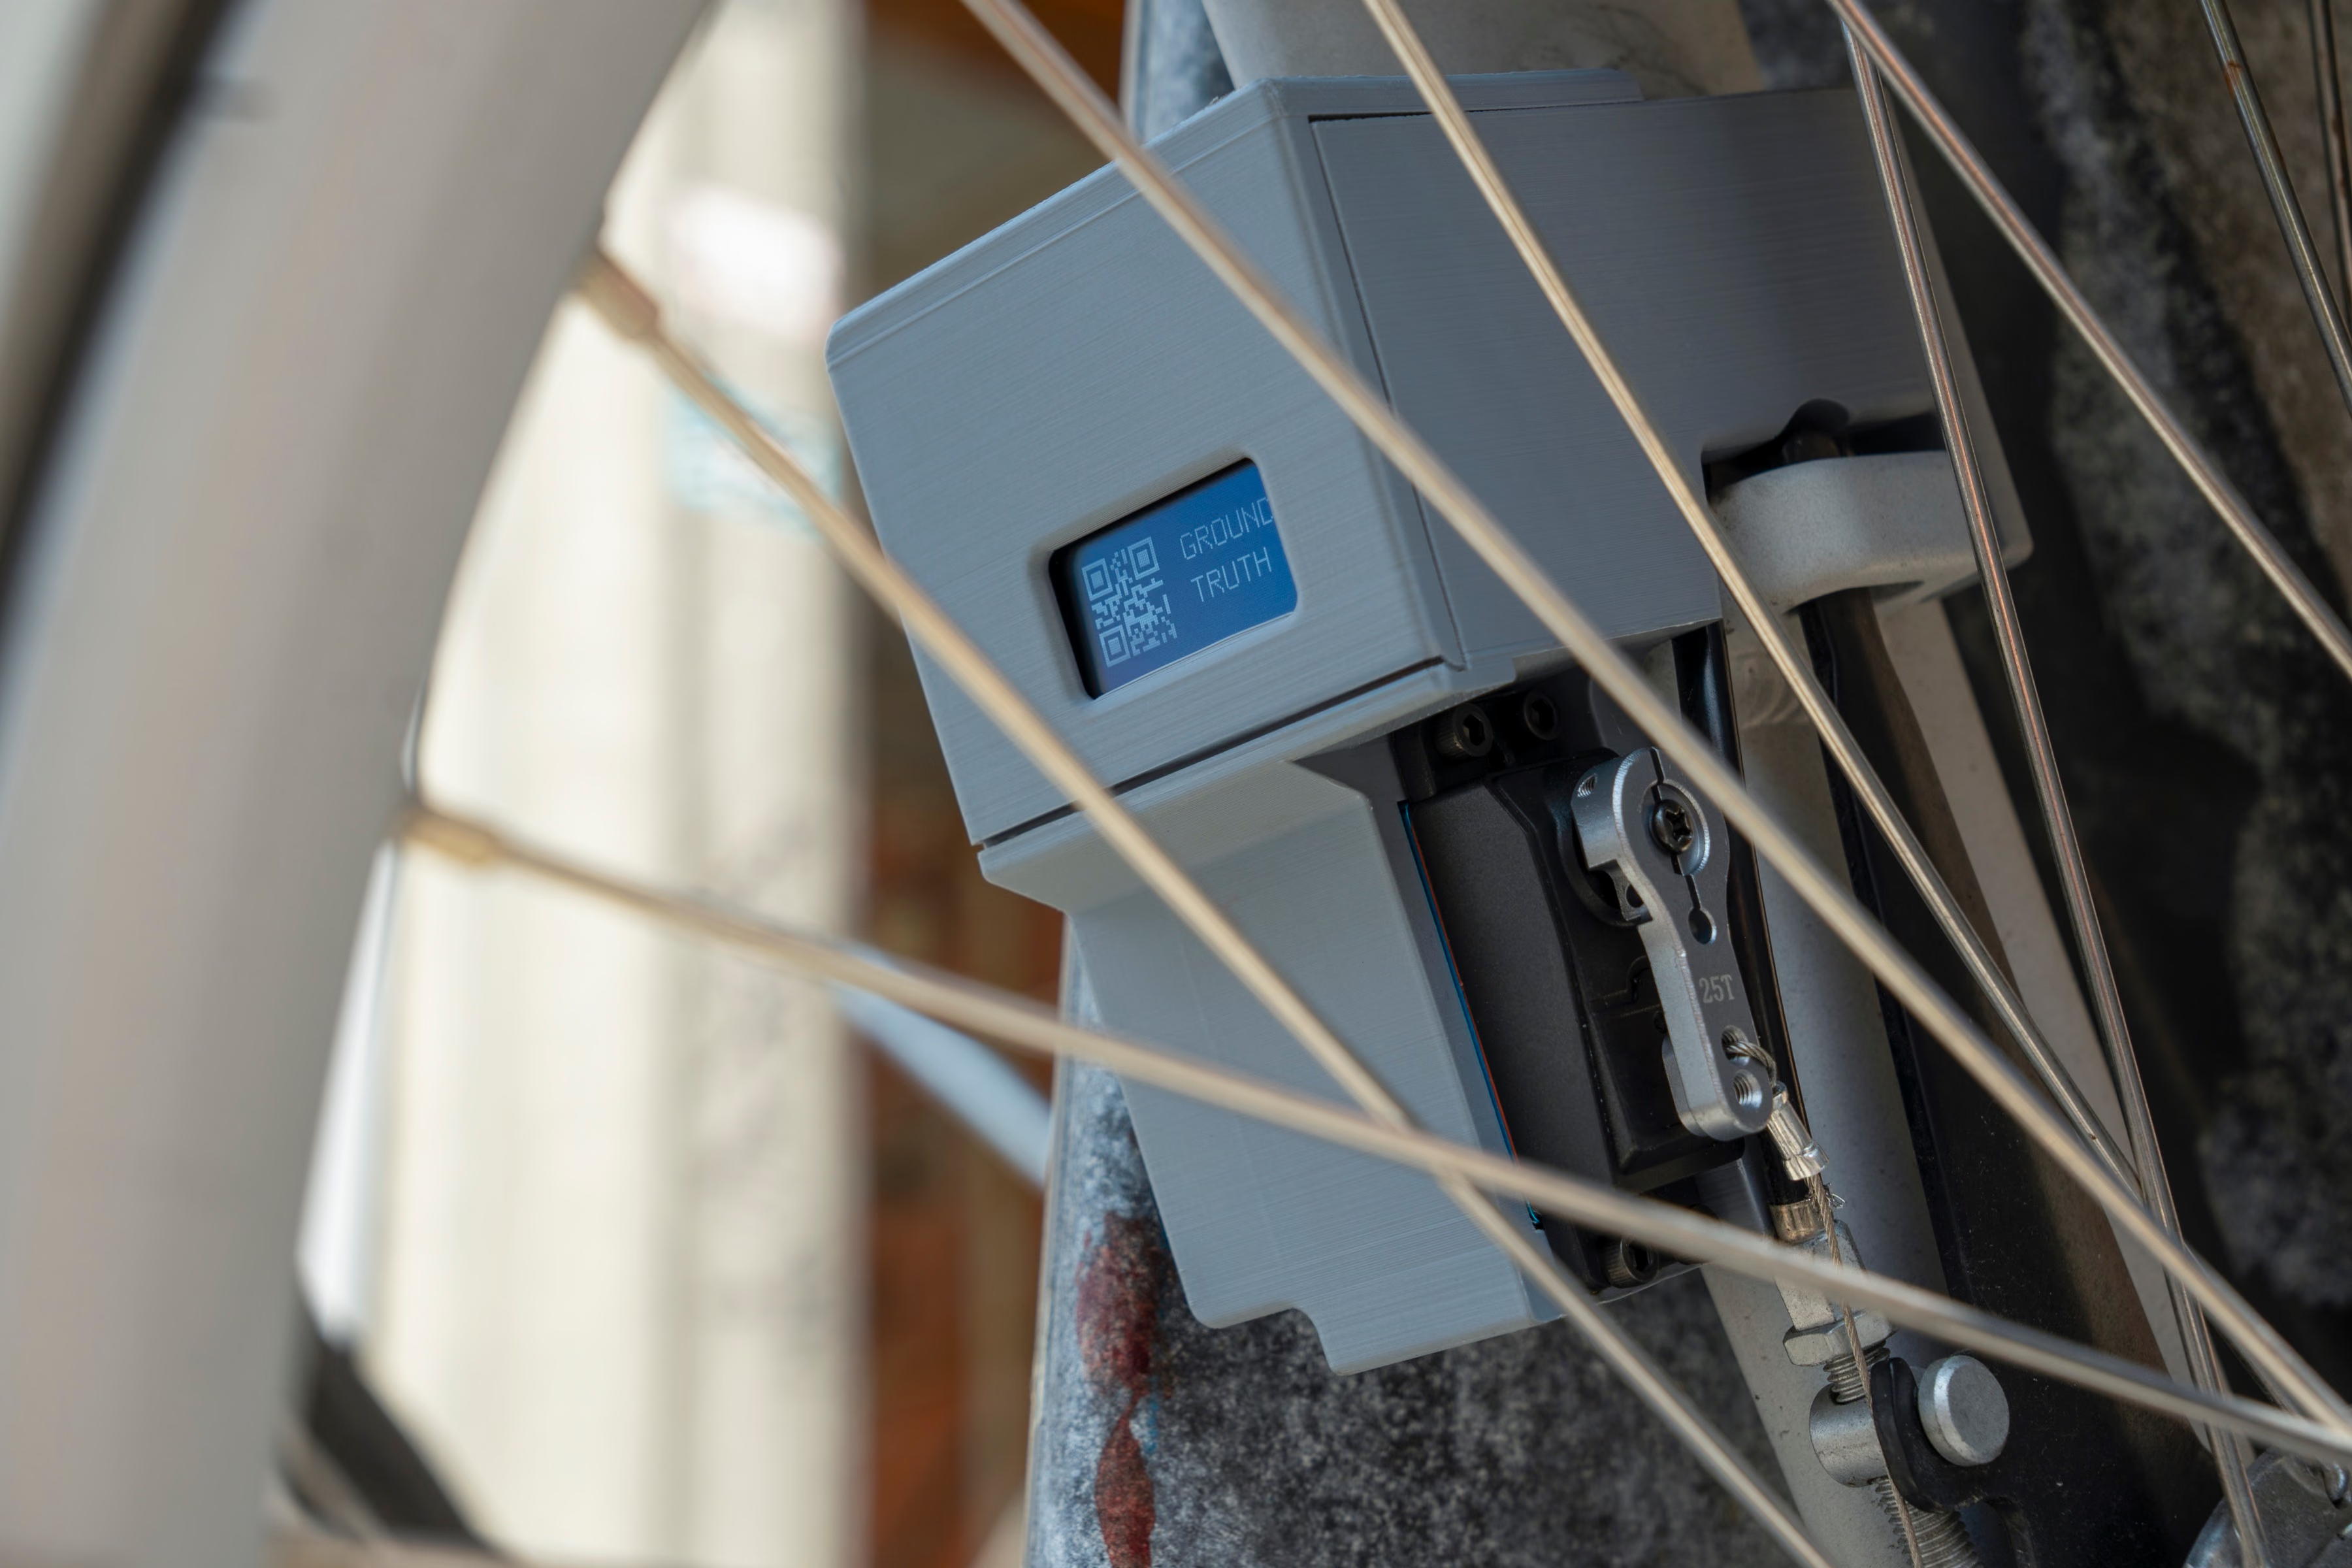
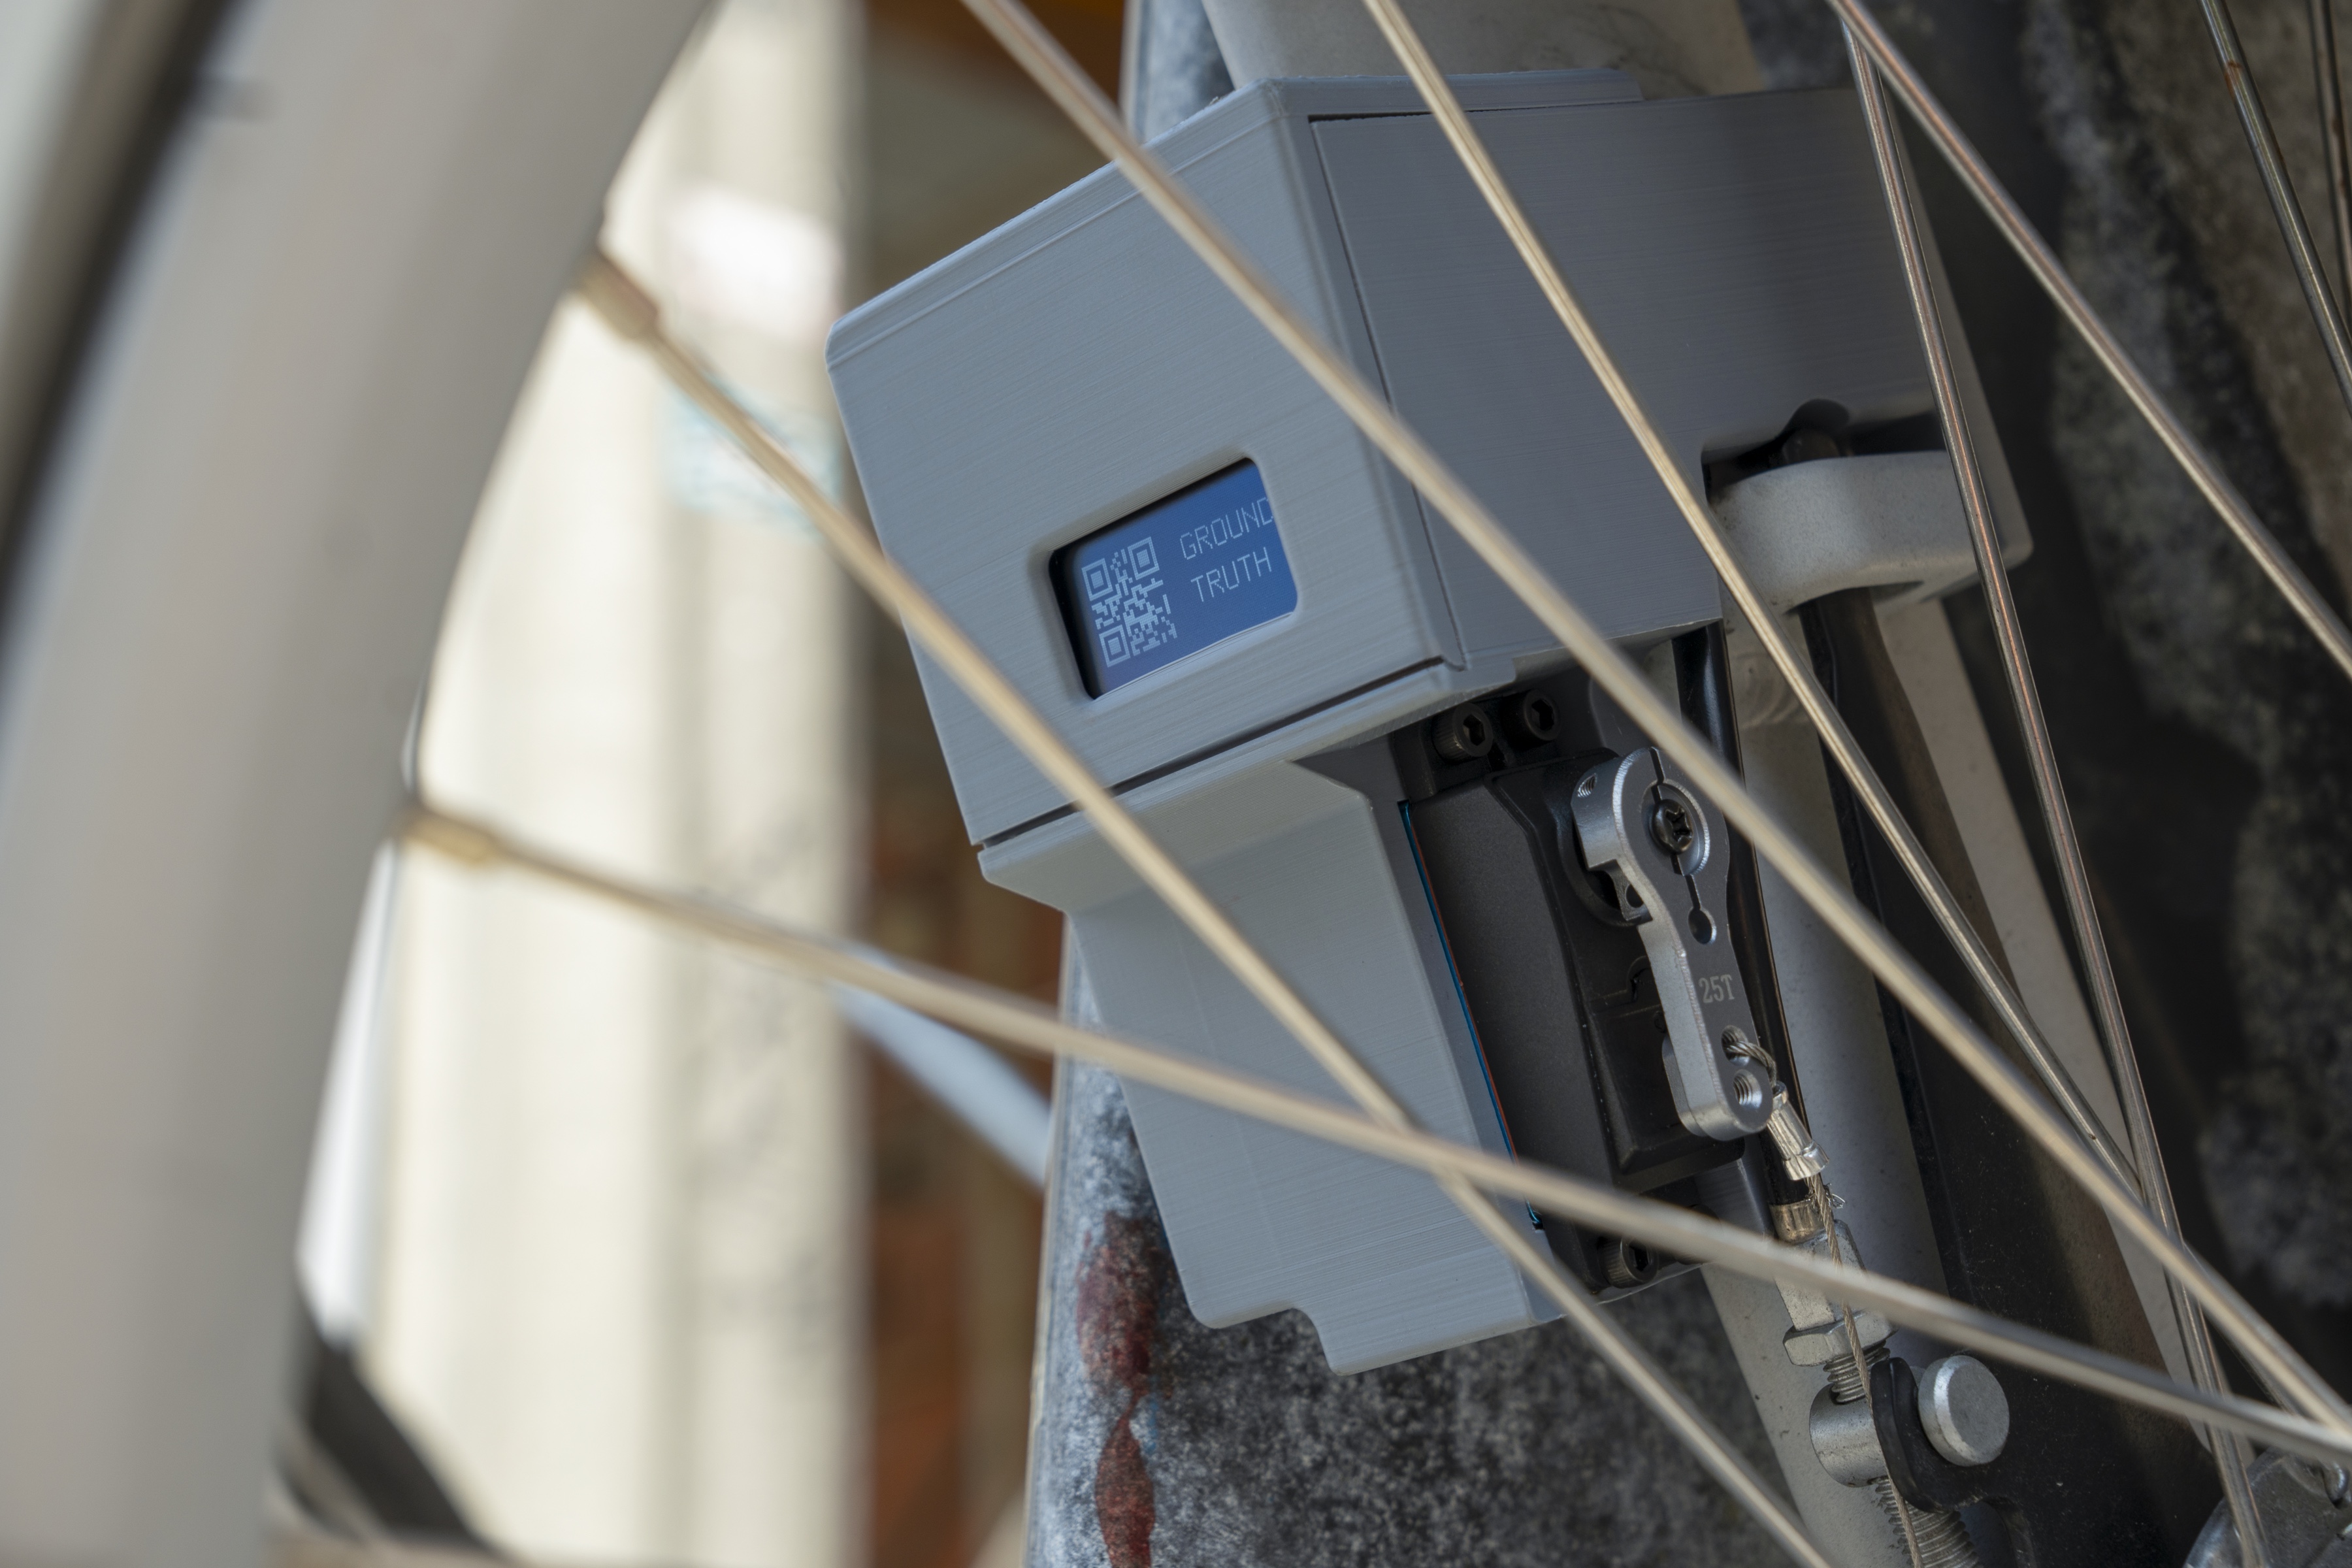
Mounted device - title screen
OLED displaying project name and a QR code linking to project site.
JPEG · 3600×2400 · 1.5 MB
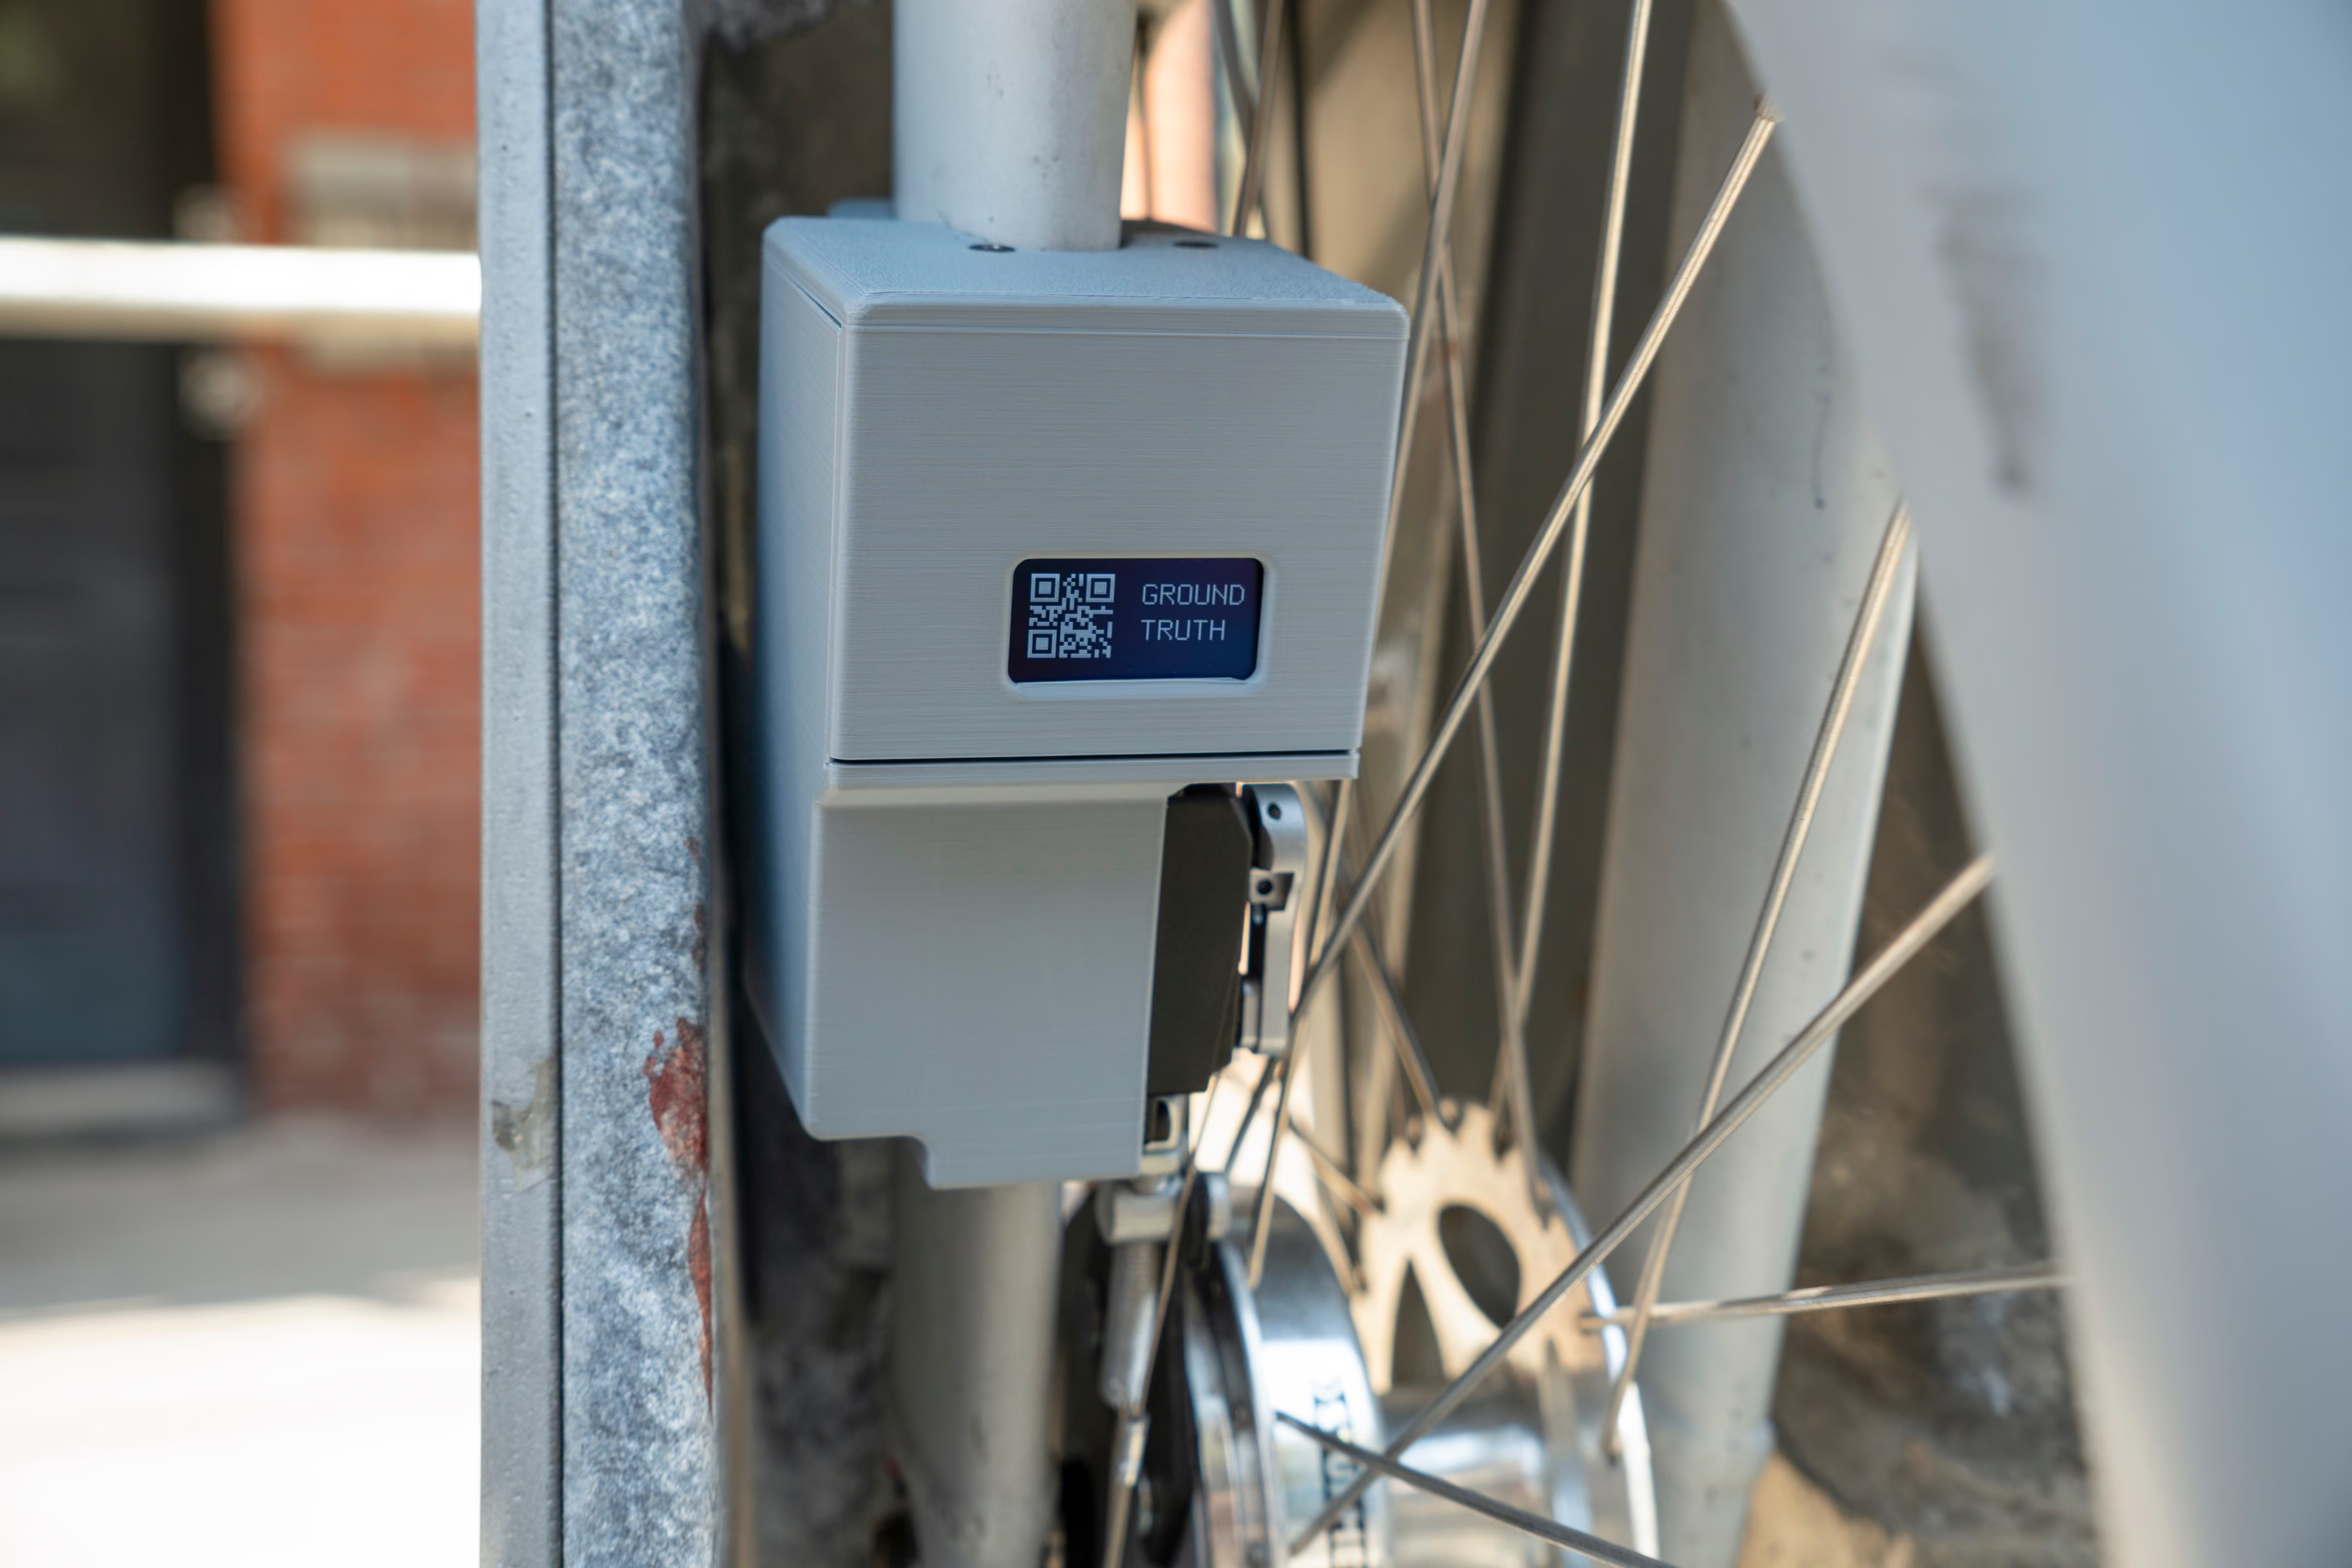
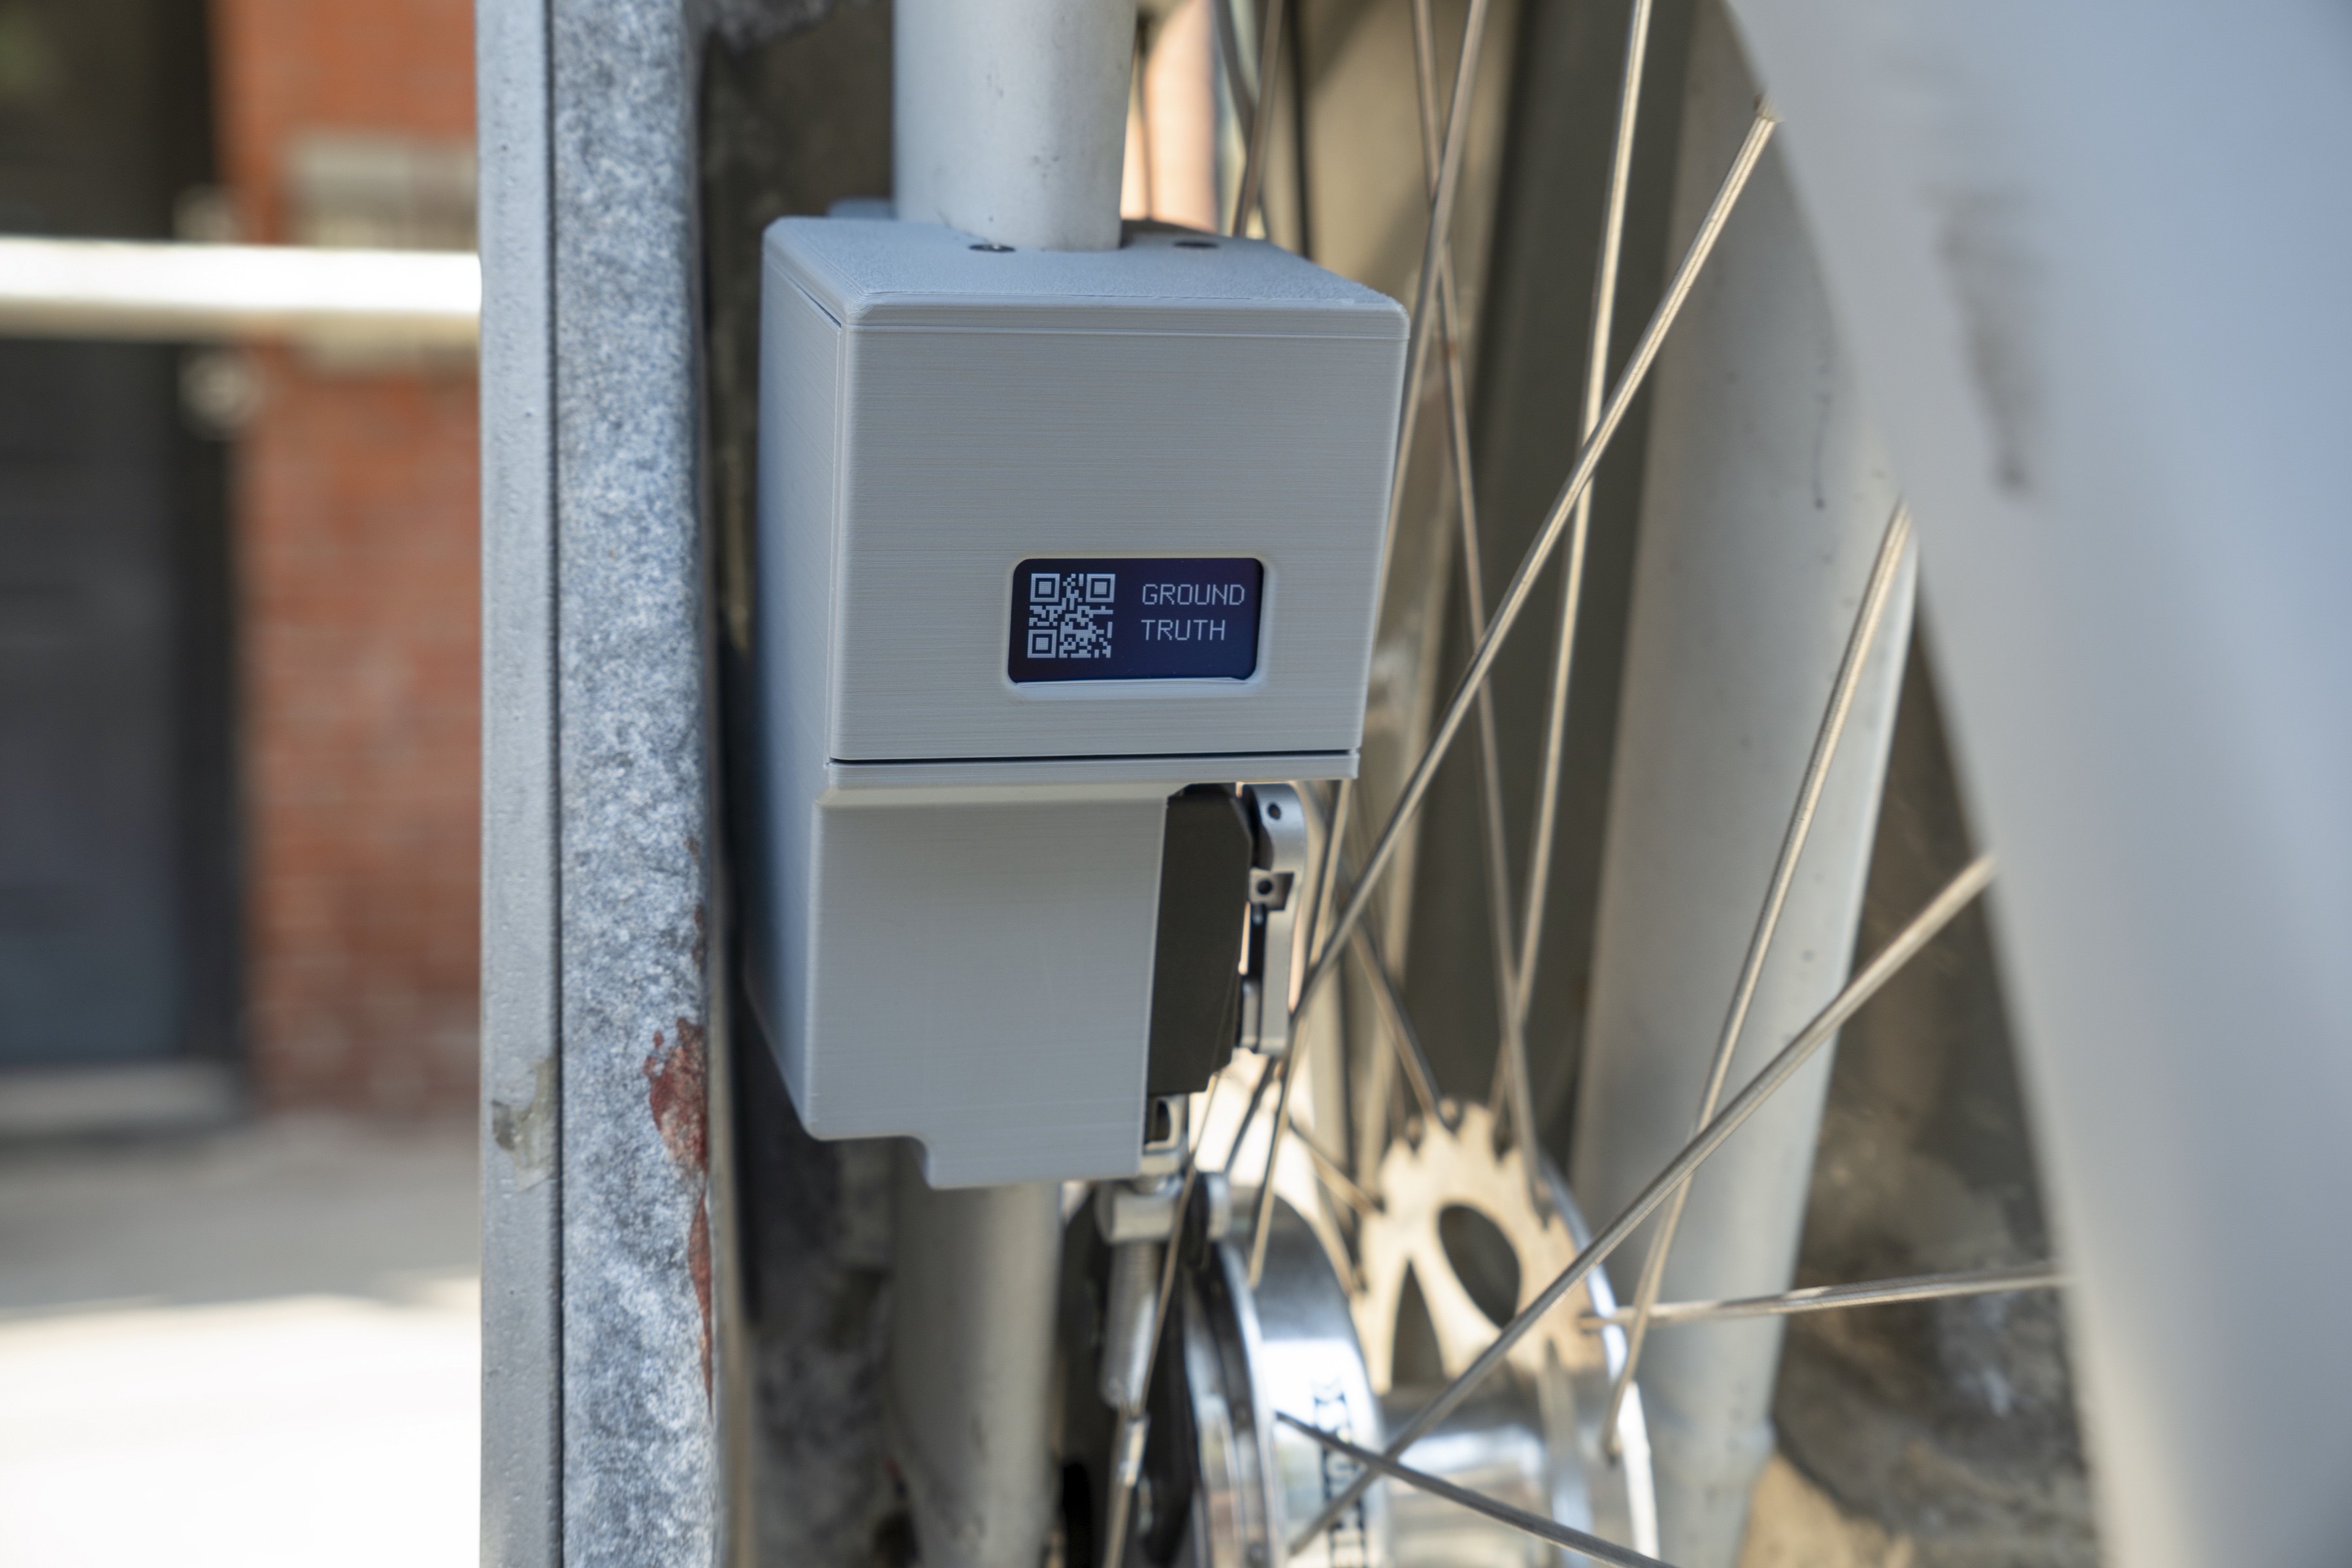
Mounted Device - title screen
OLED displaying project name and a QR code linking to project site.
JPEG · 3600×2400 · 1.4 MB
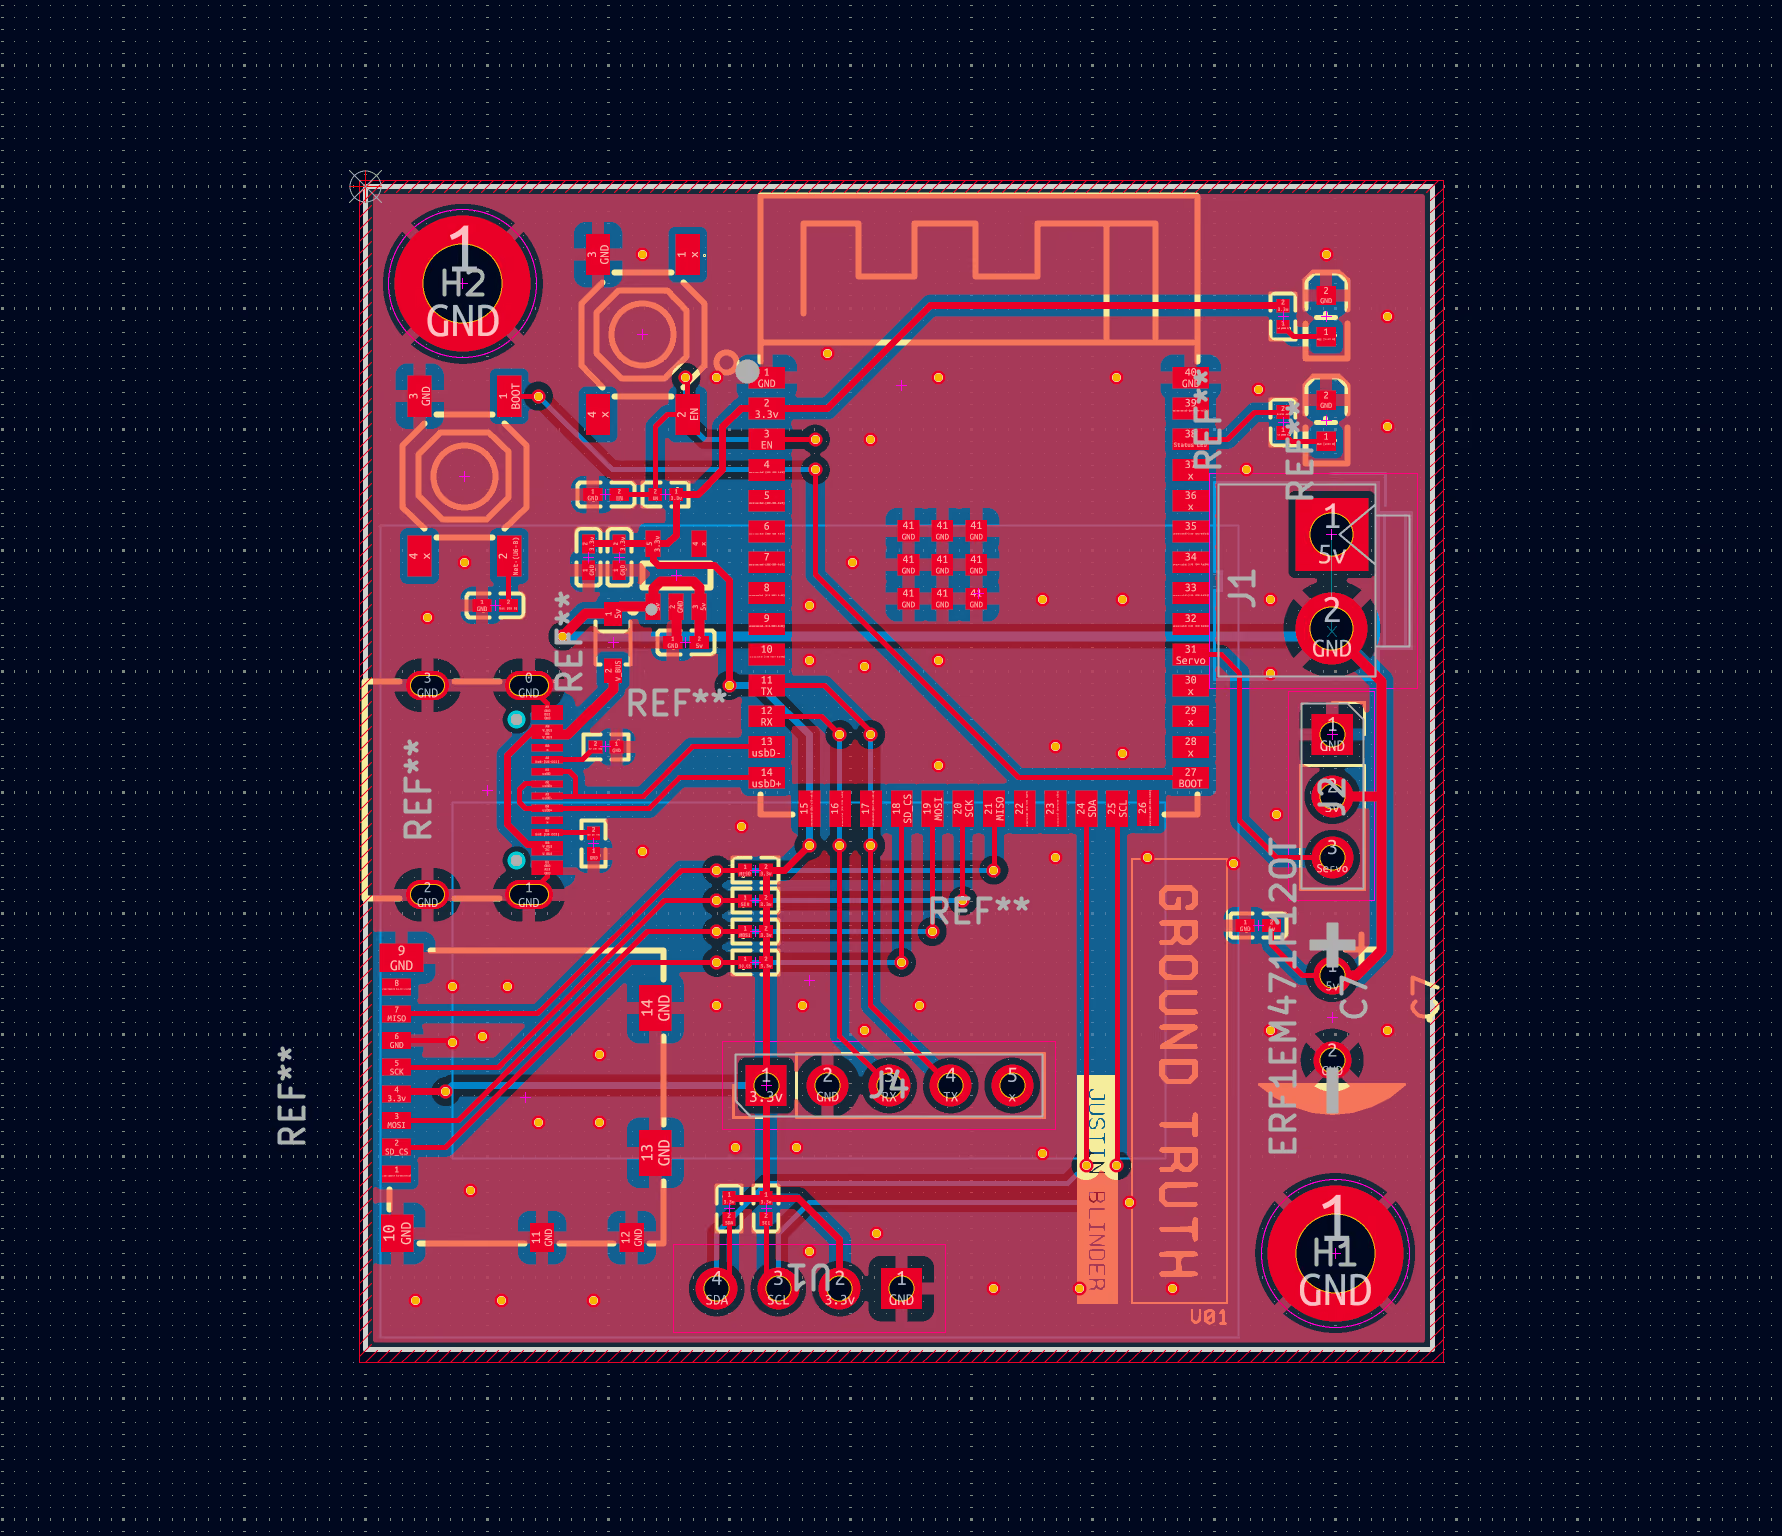
Printed circuit board layout
Layout of printed circuit board in KiCad.
PNG · 1782×1536 · 363 KB
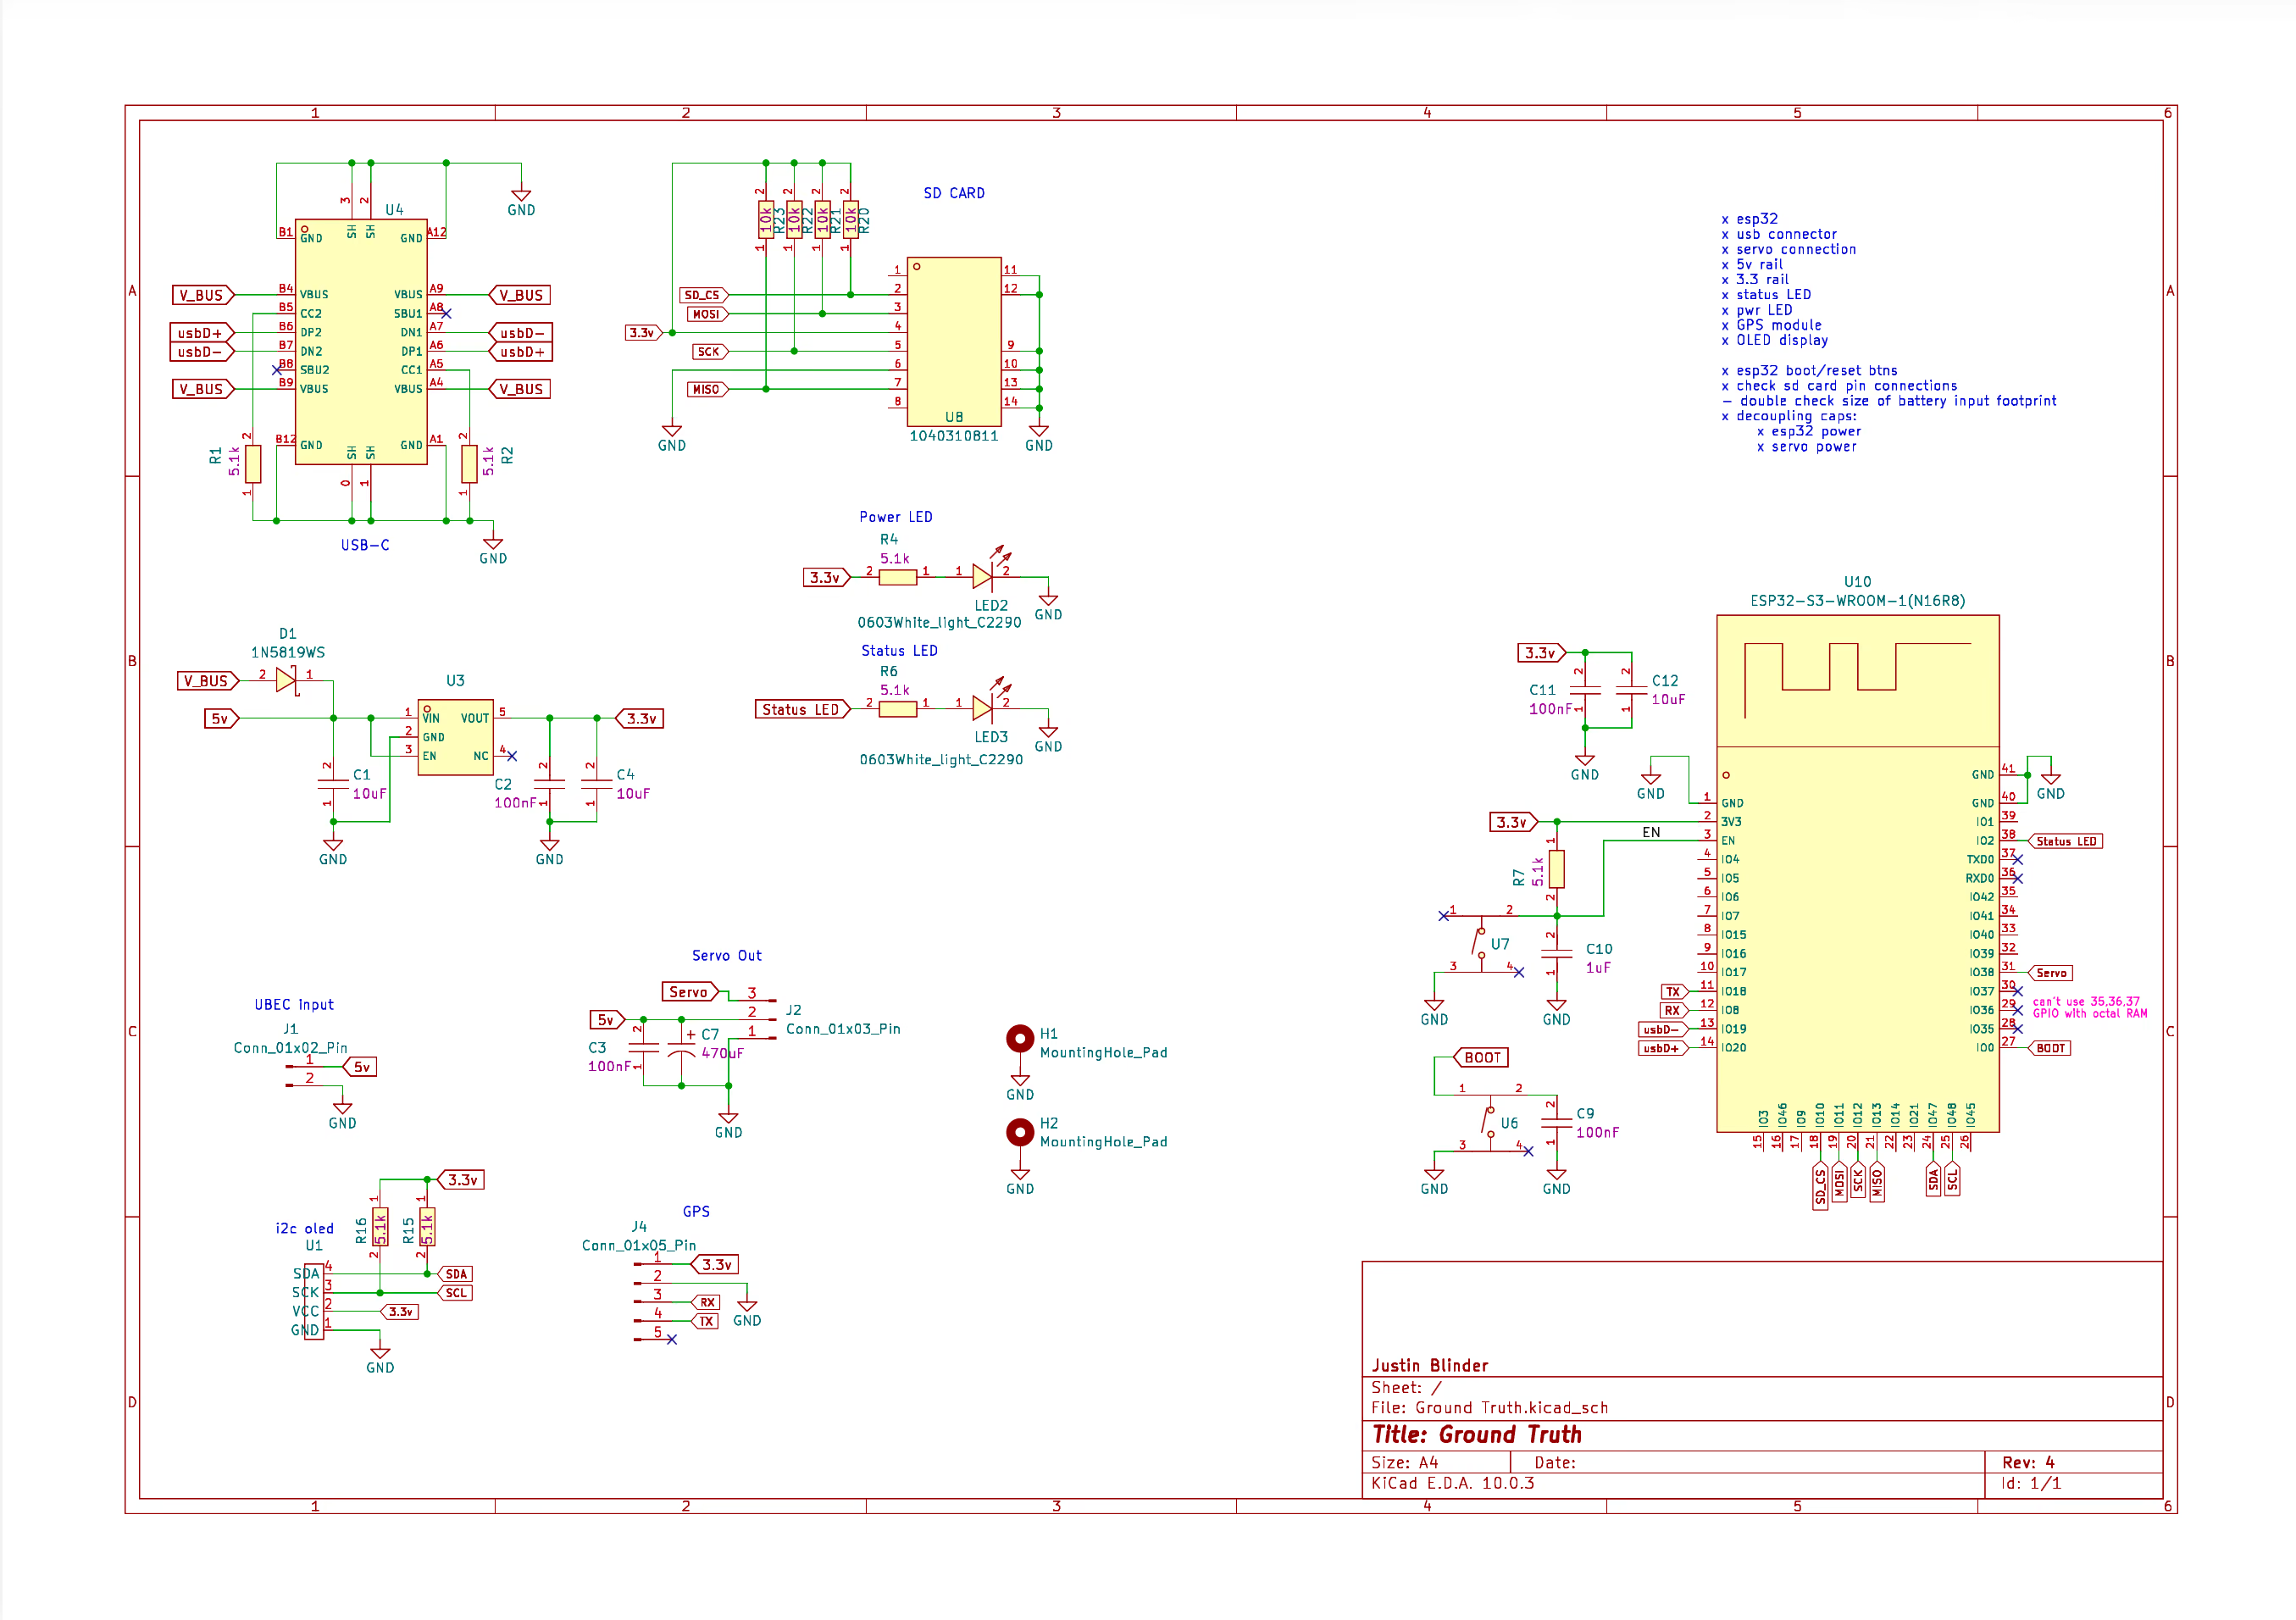
Printed circuit board schematic
Schematic of printed circuit board schematic in KiCad.
PNG · 2710×1912 · 496 KB
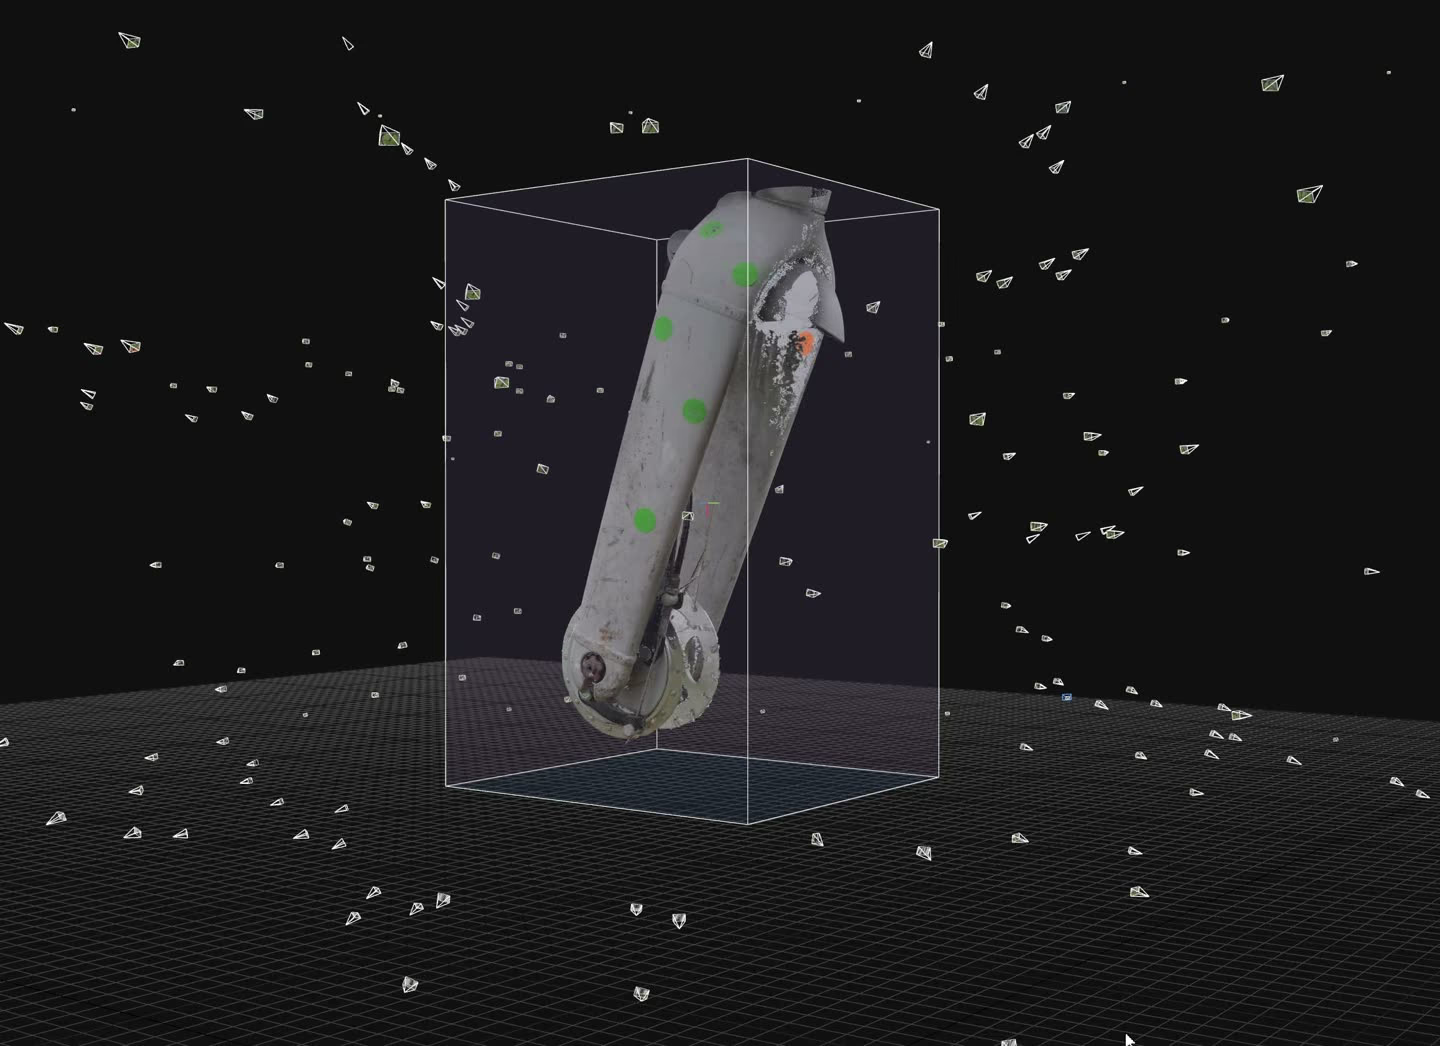
Photogrammetry capture
Scan of the electric Citi Bike front fork and drum brake hub, used to model the enclosure. Processed in Reality Capture.
MP4 · 1280×930 · 3.8 MB

Install and checkout (looping)
The device being mounted to a Citi Bike’s front wheel, then the bike checked out onto the street. Silent, loops seamlessly — used as the site’s frontispiece background.
MP4 · 1920×1080 · 7.1 MB

Limits
Instead of simulating housing insecurity, Ground Truth creates a physical glitch: a moment when abstract statistics become embodied resistance.
Ground Truth treats rent burden data ordinarily encountered as a percentage or map as effort. That difficulty does not translate to the lived experiences and hardships of those represented in the data. Friction is used as a catalyst to reflect on what is missing from top-down visualizations, what the data misses, and where our preconceptions and the built environment diverge.
The estimates are estimates
The American Community Survey is a sample, not a census. At the block-group level — the finest geography it publishes — the sample in any one area is small, and the margins of error are correspondingly wide. Two neighbouring block groups that appear to differ may not differ at all; the apparent boundary between them can be an artifact of sampling rather than a fact about the street.
Some block groups have no published estimate. Where the sample is too small or too unreliable to release, the ACS suppresses the value. The device and the map both show these as no reading rather than as zero — an absence of data is not an absence of pressure, and rendering it as flat ground would be a lie told by the visualization rather than by the data.
Rent burden is one lens
Rent burden measures what share of income goes to housing. It does not measure overcrowding, housing quality, eviction risk, informal or unrecorded tenancy, the security of a lease, surveillance, harassment, feelings of safety, or how long a household has been holding on. A block group can register as moderately burdened while its residents are under acute pressure of a kind this number cannot see.
It also says nothing about homeowners, and nothing about people with no housing at all — who are, by construction, absent from a survey of households.
The high-income correction described in the previous section is a partial fix for one known distortion: a household with a large income may choose to spend heavily on housing without strain, which inflates a block group’s median burden without reflecting hardship. Excluding that group helps. It does not make a neighborhood-level average into a statement about any particular household, and no version of this data can.
Time
The five-year estimates describe 2020 through 2024. New York’s housing market has not held still since, and the terrain the map renders is the shape of a recent past rather than of this morning. A rider is feeling the resistance of a neighbourhood as it was measured, not as it is.
Safety, and the bike
The servo’s range was calibrated so that resistance stays continuous and rideable — the intent is a felt gradient, never a sudden stop, and never completely stopping the bike from being ridable. The mechanism pulls the existing brake arm along the axis its own lever cable uses. The rider’s own brake levers remain fully functional and always override. The device does not permanently alter a bike and can be removed by hand in seconds.
The device does not connect to the internet or collect data. The dataset it reads is stored on the device.
Finally, although Ground Truth occupies legally ambiguous territory, installing and testing the device often left the bikes safer than they were found. Namely, across dozens of Citi Bikes, roughly one in four had a loose front-brake cable that rendered the front brake ineffective. I corrected these issues during the installation and removal process.
Citi Bike, you’re welcome.
Colophon
Ground Truth is an artwork by Justin Blinder.
Sources
The affordability composite is derived from American Community Survey five-year estimates at the block-group level, published by the United States Census Bureau. The 30 percent cost-burden threshold is the standard used by the U.S. Department of Housing and Urban Development.
Special Thanks

Made possible with generous support from Idle Hands.
***
With gratitude
- Linden Renz
- Gabrielle Sirkin
- Natalia Villalobos
- Lance Weiler
- Dasia Jenkins
- Lincoln Restler
- Niles Fromm
- Rose Bush
- Nimrod Shapira
- Lize Mogel
- Celina Su
- Brynn Wallace
- Connie Liu
- Samuel Stein
- Prospect Park Alliance